LensCrafters 2006 Annual Report Download - page 105
Download and view the complete annual report
Please find page 105 of the 2006 LensCrafters annual report below. You can navigate through the pages in the report by either clicking on the pages listed below, or by using the keyword search tool below to find specific information within the annual report.-
 1
1 -
2
-
3
-
4
-
5
-
6
-
7
-
8
-
9
-
10
-
11
-
12
-
13
-
14
-
15
-
16
-
17
-
18
-
19
-
20
-
21
-
22
-
23
-
24
-
25
-
26
-
27
-
28
-
29
-
30
-
31
-
32
-
33
-
34
-
35
-
36
-
37
-
38
-
39
-
40
-
41
-
42
-
43
-
44
-
45
-
46
-
47
-
48
-
49
-
50
-
51
-
52
-
53
-
54
-
55
-
56
-
57
-
58
-
59
-
60
-
61
-
62
-
63
-
64
-
65
-
66
-
67
-
68
-
69
-
70
-
71
-
72
-
73
-
74
-
75
-
76
-
77
-
78
-
79
-
80
-
81
-
82
-
83
-
84
-
85
-
86
-
87
-
88
-
89
-
90
-
91
-
92
-
93
-
94
-
 95
95 -
 96
96 -
 97
97 -
 98
98 -
 99
99 -
 100
100 -
 101
101 -
 102
102 -
 103
103 -
 104
104 -
 105
105 -
 106
106 -
 107
107 -
 108
108 -
 109
109 -
 110
110 -
 111
111 -
 112
112 -
 113
113 -
 114
114 -
 115
115 -
116
-
117
-
118
-
119
-
120
-
121
-
122
-
123
-
124
-
125
-
126
-
127
-
128
-
129
-
130
-
131
-
132
-
133
-
134
-
135
-
136
-
137
-
138
-
139
-
140
-
141
-
142
-
143
-
144
-
145
-
146
-
147
-
148
-
149
-
150
-
151
-
152
-
153
-
154
-
155
-
156
-
157
-
158
-
159
-
160
-
161
-
162
-
163
-
164
-
165
-
166
 |
 |

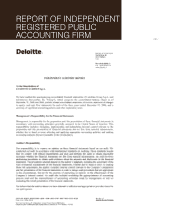
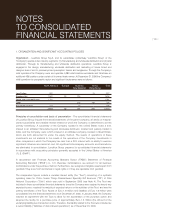
REPORT OF
INDEPENDENT REGISTERED
PUBLIC ACCOUNTING FIRM |105 <
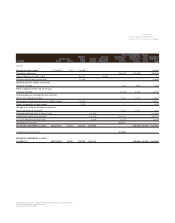
Other Accumulated other Treasury
Additional Unearned comprehensive comprehensive shares Consolidated
Common stock paid-in Retained Stock-based income (loss), income (loss), amount, shareholders’
(Euro/000) Shares Amount capital earnings compensation net of tax net of tax at cost equity
(cont’d)
Exercise of stock options 2,240,525 134 24,308 24,443
Translation adjustment (126,853) (126,853) (126,853)
Effect of adoption of SFAS 123 R (48,567) 48,567
Realized stock based compensation 47,969 47,969
Minimum pension, liability, net of taxes
of Euro 0.4 million (624) (624) (624)
Effect of adoption SFAS 158, net of taxes
of Euro 5.5 million (8,409) (8,409) (8,409)
Unrealized gain on available-for-sale securities,
net of taxes of Euro 0.5 million 1,244 1,244 1,244
Diluted gain on business acquisitions, SAB 5-H gain 21,847 21,847
Excess tax benefit on stock options 7,279 7,279
Change in fair value of derivative instruments,
net of taxes of Euro 1.8 million 2,003 2,003 2,003
Dividends declared (Euro 0.29 per share) (131,369) (131,369)
Income from continuing operations 430,705 430,705 430,705
(Loss) on discontinued operations (6,419) (6,419) (6,419)
Comprehensive income 291,647
BALANCES, DECEMBER 31, 2006 460,216,248 27,613 203,016 2,343,800 - (288,593) (69,987) 2,215,849
Comprehensive income (1) 384,886
BALANCES, DECEMBER 31, 2006
(US$/000) (1) 460,216,248 36,440 267,920 3,093,113 - (380,856) (92,362) 2,924,256
(1) Translated for convenience at the New York City Noon Buying Rate as determined in Note 1
See notes to Consolidated Financial Statements.
(*) In accordance with U.S. GAAP.