LensCrafters 2006 Annual Report Download - page 104
Download and view the complete annual report
Please find page 104 of the 2006 LensCrafters annual report below. You can navigate through the pages in the report by either clicking on the pages listed below, or by using the keyword search tool below to find specific information within the annual report.-
 1
1 -
2
-
3
-
4
-
5
-
6
-
7
-
8
-
9
-
10
-
11
-
12
-
13
-
14
-
15
-
16
-
17
-
18
-
19
-
20
-
21
-
22
-
23
-
24
-
25
-
26
-
27
-
28
-
29
-
30
-
31
-
32
-
33
-
34
-
35
-
36
-
37
-
38
-
39
-
40
-
41
-
42
-
43
-
44
-
45
-
46
-
47
-
48
-
49
-
50
-
51
-
52
-
53
-
54
-
55
-
56
-
57
-
58
-
59
-
60
-
61
-
62
-
63
-
64
-
65
-
66
-
67
-
68
-
69
-
70
-
71
-
72
-
73
-
74
-
75
-
76
-
77
-
78
-
79
-
80
-
81
-
82
-
83
-
84
-
85
-
86
-
87
-
88
-
89
-
90
-
91
-
92
-
93
-
 94
94 -
 95
95 -
 96
96 -
 97
97 -
 98
98 -
 99
99 -
 100
100 -
 101
101 -
 102
102 -
 103
103 -
 104
104 -
 105
105 -
 106
106 -
 107
107 -
 108
108 -
 109
109 -
 110
110 -
 111
111 -
 112
112 -
 113
113 -
 114
114 -
115
-
116
-
117
-
118
-
119
-
120
-
121
-
122
-
123
-
124
-
125
-
126
-
127
-
128
-
129
-
130
-
131
-
132
-
133
-
134
-
135
-
136
-
137
-
138
-
139
-
140
-
141
-
142
-
143
-
144
-
145
-
146
-
147
-
148
-
149
-
150
-
151
-
152
-
153
-
154
-
155
-
156
-
157
-
158
-
159
-
160
-
161
-
162
-
163
-
164
-
165
-
166
 |
 |

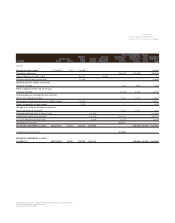
STATEMENTS
OF CONSOLIDATED
SHAREHOLDERS' EQUITY
FOR THE YEARS ENDED
DECEMBER 31, 2004,
2005 AND 2006 (*)
Other Accumulated other Treasury
Additional Unearned comprehensive comprehensive shares Consolidated
Common stock paid-in Retained Stock-based income (loss), income (loss), amount, shareholders’
(Euro/000) Shares Amount capital earnings compensation net of tax net of tax at cost equity
BALANCES, JANUARY 1, 2004 454,477,033 27,269 40,423 1,619,312 (242,483) (69,987) 1,374,534
Exercise of stock options 728,440 43 5,950 5,993
Translation adjustment (79,897) (79,897) (79,897)
Minimum pension, liability, net
of taxes of Euro 0.2 million 248 248 248
Tax benefit on stock options 794 794
Change in fair value of derivative
instruments, net of taxes of Euro 0,2 million 1,174 1,174 1,174
Dividends declared (Euro 0.21 per share) (94,113) (94,113)
Income from continuing operations 279,109 279,109 279,109
Income from discontinued operations 7,765 7,765 7,765
Comprehensive income 208,399
BALANCES, DECEMBER 31, 2004 455,205,473 27,312 47,167 1,812,073 (320,958) (69,987) 1,495,607
Exercise of stock options 2,770,250 167 28,062 28,229
Translation adjustment 157,776 157,776 157,776
Aggregate stock based compensation 70,273 (70,273)
Realized stock based compensation 21,706 21,706
Minimum pension, liability, net of taxes
of Euro 1,6 million 2,534 2,534 2,534
Tax benefit on stock options 4,677 4,677
Change in fair value of derivative instruments,
net of taxes of Euro 2.3 million 4,694 4,694 4,694
Dividends declared (Euro 0.23 per share) (103,484) (103,484)
Income from continuing operations 330,790 330,790 330,790
Income from discontinued operations 11,504 11,504 11,504
Comprehensive income 507,298
BALANCES, DECEMBER 31, 2005 457,975,723 27,479 150,179 2,050,883 (48,567) (155,954) (69,987) 1,954,033
(cont’d)