LensCrafters 2006 Annual Report Download - page 57
Download and view the complete annual report
Please find page 57 of the 2006 LensCrafters annual report below. You can navigate through the pages in the report by either clicking on the pages listed below, or by using the keyword search tool below to find specific information within the annual report.-
 1
1 -
2
-
3
-
4
-
5
-
6
-
7
-
8
-
9
-
10
-
11
-
12
-
13
-
14
-
15
-
16
-
17
-
18
-
19
-
20
-
21
-
22
-
23
-
24
-
25
-
26
-
27
-
28
-
29
-
30
-
31
-
32
-
33
-
34
-
35
-
36
-
37
-
38
-
39
-
40
-
41
-
42
-
43
-
44
-
45
-
46
-
 47
47 -
 48
48 -
 49
49 -
 50
50 -
 51
51 -
 52
52 -
 53
53 -
 54
54 -
 55
55 -
 56
56 -
 57
57 -
 58
58 -
 59
59 -
 60
60 -
 61
61 -
 62
62 -
 63
63 -
 64
64 -
 65
65 -
 66
66 -
 67
67 -
68
-
69
-
70
-
71
-
72
-
73
-
74
-
75
-
76
-
77
-
78
-
79
-
80
-
81
-
82
-
83
-
84
-
85
-
86
-
87
-
88
-
89
-
90
-
91
-
92
-
93
-
94
-
95
-
96
-
97
-
98
-
99
-
100
-
101
-
102
-
103
-
104
-
105
-
106
-
107
-
108
-
109
-
110
-
111
-
112
-
113
-
114
-
115
-
116
-
117
-
118
-
119
-
120
-
121
-
122
-
123
-
124
-
125
-
126
-
127
-
128
-
129
-
130
-
131
-
132
-
133
-
134
-
135
-
136
-
137
-
138
-
139
-
140
-
141
-
142
-
143
-
144
-
145
-
146
-
147
-
148
-
149
-
150
-
151
-
152
-
153
-
154
-
155
-
156
-
157
-
158
-
159
-
160
-
161
-
162
-
163
-
164
-
165
-
166
 |
 |

MANAGEMENT’S
DISCUSSION AND ANALYSIS |57 <
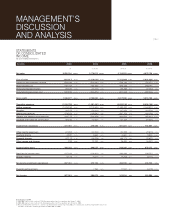
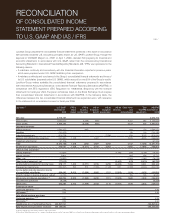
The following table sets forth for the periods indicated the amount and percentage of net sales
represented by certain items included in the Company's statements of consolidated income:
Net sales. Net sales increased 13.1% to Euro 4,676.2 million during 2006 as compared to
Euro 4,134.3 million in 2005. The increases in the Company’s net sales primarily resulted from the
strong performance in both the retail and the manufacturing and wholesale segments, which was
partially offset by approximately Euro 34.9 million (equivalent to 0.9%) in negative currency
fluctuations between the Euro, which is the Company’s reporting currency, and other currencies in
which the Company conducts its business, including the US Dollar and the Australian Dollar. After
the effect of currency fluctuations, the manufacturing and wholesale segment had an increase in
net sales to third parties of approximately Euro 307.0 million and the retail segment had an
increase in net sales of approximately Euro 234.9 million. Currency fluctuations offset the net sales
for the manufacturing and wholesale segment by approximately Euro 1.9 million and by
approximately Euro 33.0 million for the retail segment.
Net sales in the retail segment increased by 7.6% to Euro 3,294.2 million for 2006 from
Euro 3,061.7 million in 2005. Euro 208.1 million of this increase was attributable to the positive
performance of the North American retail operations primarily due to: (i) a 7.1% increase in same-
store sales, and (ii) the addition of US$ 26.7 million in sales from the approximately 70 new
Canadian retail outlets which were acquired in June 2006, which was partially offset by (iii) a
negative exchange rate effect of Euro 25.0 million. An additional Euro 20.2 million of the increase
was attributable to an increase in net sales in the Asia-Pacific retail business, primarily due to
Euro 11.3 million in additional net sales contributed by the newly acquired stores in the People’s
Republic of China.
Net sales to third parties in the manufacturing and wholesale segment increased by 28.6% to
Euro 1,382.0 million for 2006 as compared to Euro 1,075.0 million in 2005. This increase was
mainly attributable to increased sales of our Ray-Ban brand as well as the continued success of
sales of branded products of our designer lines, such as Prada and Bvlgari, and the continued
development of new branded products such as Dolce & Gabbana (which we began distributing in
October 2005). These increases occurred primarily in the European and North American markets,
which account for approximately 78.5% of our net sales to third parties in our manufacturing and
wholesale segment.
RESULTS OF OPERATIONS
FOR THE YEARS ENDED
DECEMBER 31, 2005
AND 2006
Year ended December 31, (Euro/000) 2005 2006
Net sales 4,134,263 100.0% 4,676,156 100.0%
Cost of sales 1,316,664 31.8% 1,426,000 30.5%
Gross profit 2,817,598 68.2% 3,250,156 69.5%
Selling and advertising expenses 1,774,241 42.9% 1,967,034 42.1%
General and administrative expenses 461,957 11.2% 527,135 11.3%
Income from operations 581,401 14.1% 755,987 16.2%
Other income/(net expenses) (42,092) 1.0% (77,810) 1.7%
Pre-tax income 539,309 13.0% 678,177 14.5%
Income taxes 199,266 4.8% 238,757 5.1%
Minority interests 9,253 0.2% 8,715 0.2%
Net income (continuing operations) 330,790 8.0% 430,705 9.2%
Discontinued operations 11,504 0.3% (6,419) 0.1%
Net income 342,294 8.3% 424,286 9.1%
Prior year amounts have been reclassified to include revenues and expenses of the Things Remembered personalized gifts specialty retailer business, which
was sold in September 2006, as a single line item under discontinued operations.