LensCrafters 2006 Annual Report Download - page 116
Download and view the complete annual report
Please find page 116 of the 2006 LensCrafters annual report below. You can navigate through the pages in the report by either clicking on the pages listed below, or by using the keyword search tool below to find specific information within the annual report.-
 1
1 -
2
-
3
-
4
-
5
-
6
-
7
-
8
-
9
-
10
-
11
-
12
-
13
-
14
-
15
-
16
-
17
-
18
-
19
-
20
-
21
-
22
-
23
-
24
-
25
-
26
-
27
-
28
-
29
-
30
-
31
-
32
-
33
-
34
-
35
-
36
-
37
-
38
-
39
-
40
-
41
-
42
-
43
-
44
-
45
-
46
-
47
-
48
-
49
-
50
-
51
-
52
-
53
-
54
-
55
-
56
-
57
-
58
-
59
-
60
-
61
-
62
-
63
-
64
-
65
-
66
-
67
-
68
-
69
-
70
-
71
-
72
-
73
-
74
-
75
-
76
-
77
-
78
-
79
-
80
-
81
-
82
-
83
-
84
-
85
-
86
-
87
-
88
-
89
-
90
-
91
-
92
-
93
-
94
-
95
-
96
-
97
-
98
-
99
-
100
-
101
-
102
-
103
-
104
-
105
-
 106
106 -
 107
107 -
 108
108 -
 109
109 -
 110
110 -
 111
111 -
 112
112 -
 113
113 -
 114
114 -
 115
115 -
 116
116 -
 117
117 -
 118
118 -
 119
119 -
 120
120 -
 121
121 -
 122
122 -
 123
123 -
 124
124 -
 125
125 -
 126
126 -
127
-
128
-
129
-
130
-
131
-
132
-
133
-
134
-
135
-
136
-
137
-
138
-
139
-
140
-
141
-
142
-
143
-
144
-
145
-
146
-
147
-
148
-
149
-
150
-
151
-
152
-
153
-
154
-
155
-
156
-
157
-
158
-
159
-
160
-
161
-
162
-
163
-
164
-
165
-
166
 |
 |

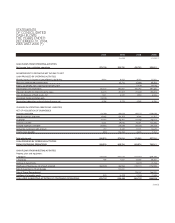
>116 | ANNUAL REPORT 2006
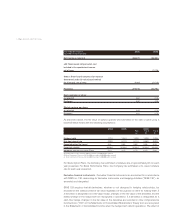
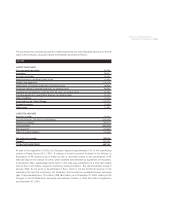
Year ended December 31, 2004 2005
(Euro/000, except share data)
Net income as reported 286,874 342,294
add: Stock-based compensation cost
included in the reported net income,
net of taxes - 21,706
deduct: Stock-based compensation expense
determined under fair-value based method
for all awards, net of taxes (9,964) (23,203)
Pro-forma 276,910 340,797
Basic earnings per share:
As reported 0.64 0.76
Pro-forma 0.62 0.76
Diluted earnings per share:
As reported 0.64 0.76
Pro-forma 0.61 0.75
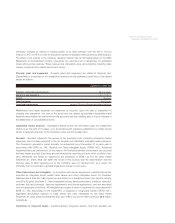
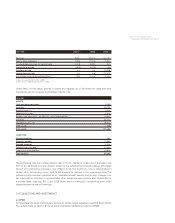
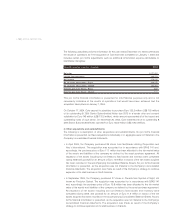
As described above, the fair value of options granted was estimated on the date of grant using a
binomial lattice model with the following assumptions:
2004 2005 2006
Plan I Plan II Plan III
(a) (b) (c)
Dividend yield 1.71% 1.54% 1.33% 1.33% 1.33%
Risk-free interest rate 2.92% 3.17% 3.11% 3.88% 3.89%
Expected option life (years) 5.44 5.84 5.80 5.36 5.53
Expected volatility 36.56% 25.92% 25.91% 26.63% 26.63%
Weighted average fair value (Euro) 5.10 4.27 5.72 6.15 5.80
(a) Ordinary Plan issued in February 2006 for a total of 1,725,000 options granted.
(b) Stock Performance Plan issued in July 2006 for a total of 9,500,000 options granted.
(c) Stock Performance Plan issued in July 2006 for a total of 3,500,000 options granted.
For Stock Option Plans, the Company has estimated a forfeiture rate of approximately 6% for each
year presented. For Stock Performance Plans, the Company has estimated a 0% (zero) forfeiture
rate for each year presented.
Derivative financial instruments -Derivative financial instruments are accounted for in accordance
with SFAS no. 133, Accounting for Derivative Instruments and Hedging Activities (“SFAS 133”), as
amended and interpreted.
SFAS 133 requires that all derivatives, whether or not designed in hedging relationships, be
recorded on the balance sheet at fair value regardless of the purpose or intent for holding them. If
aderivative is designated as a fair-value hedge, changes in the fair value of the derivative and the
related change in the hedge item are recognized in operations. If a derivative is designated as a
cash-flow hedge, changes in the fair value of the derivative are recorded in other comprehensive
income/(loss) (“OCI”) in the Statements of Consolidated Shareholders’ Equity and are recognized
in the Statements of Consolidated Income when the hedged item affects operations. The effect of