LensCrafters 2006 Annual Report Download - page 106
Download and view the complete annual report
Please find page 106 of the 2006 LensCrafters annual report below. You can navigate through the pages in the report by either clicking on the pages listed below, or by using the keyword search tool below to find specific information within the annual report.-
 1
1 -
2
-
3
-
4
-
5
-
6
-
7
-
8
-
9
-
10
-
11
-
12
-
13
-
14
-
15
-
16
-
17
-
18
-
19
-
20
-
21
-
22
-
23
-
24
-
25
-
26
-
27
-
28
-
29
-
30
-
31
-
32
-
33
-
34
-
35
-
36
-
37
-
38
-
39
-
40
-
41
-
42
-
43
-
44
-
45
-
46
-
47
-
48
-
49
-
50
-
51
-
52
-
53
-
54
-
55
-
56
-
57
-
58
-
59
-
60
-
61
-
62
-
63
-
64
-
65
-
66
-
67
-
68
-
69
-
70
-
71
-
72
-
73
-
74
-
75
-
76
-
77
-
78
-
79
-
80
-
81
-
82
-
83
-
84
-
85
-
86
-
87
-
88
-
89
-
90
-
91
-
92
-
93
-
94
-
95
-
 96
96 -
 97
97 -
 98
98 -
 99
99 -
 100
100 -
 101
101 -
 102
102 -
 103
103 -
 104
104 -
 105
105 -
 106
106 -
 107
107 -
 108
108 -
 109
109 -
 110
110 -
 111
111 -
 112
112 -
 113
113 -
 114
114 -
 115
115 -
 116
116 -
117
-
118
-
119
-
120
-
121
-
122
-
123
-
124
-
125
-
126
-
127
-
128
-
129
-
130
-
131
-
132
-
133
-
134
-
135
-
136
-
137
-
138
-
139
-
140
-
141
-
142
-
143
-
144
-
145
-
146
-
147
-
148
-
149
-
150
-
151
-
152
-
153
-
154
-
155
-
156
-
157
-
158
-
159
-
160
-
161
-
162
-
163
-
164
-
165
-
166
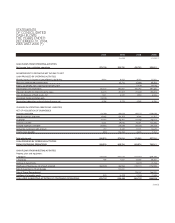
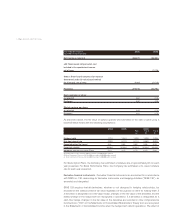
 |
 |

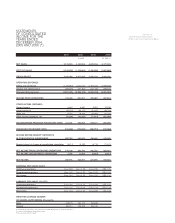
2004 2005 2006 2006
(Euro/000) (US$/000) (1)
CASH FLOWS FROM OPERATING ACTIVITIES
Net income from continuing operations 279,109 330,790 430,705 568,401
ADJUSTMENTS TO RECONCILE NET INCOME TO NET
CASH PROVIDED BY OPERATING ACTIVITIES
Minority interest in income of consolidated subsidiaries 8,614 9,253 8,715 11,501
Non cash stock-based compensation 22,711 47,969 63,304
Excess tax benefits from stock-based compensation (7,279) (9,606)
Depreciation and amortization 150,140 184,652 220,797 291,386
Provision (benefit) for deferred income taxes 46,570 (91,297) (72,509) (95,691)
Loss on disposals of fixed assets, net 7,641 6,559 4,930 6,506
Unrealized foreign exchange gain (13,445)
Termination indemnities matured during the year, net 6,768 3,723 4,369 5,766
CHANGES IN OPERATING ASSETS AND LIABILITIES,
NET OF ACQUISITION OF BUSINESSES
Accounts receivable (14,298) (33,634) (83,107) (109,676)
Prepaid expenses and other 19,963 (56,767) 8,568 11,307
Inventories 34,190 66,491 (27,658) (36,501)
Accounts payable 6,241 49,615 76,021 100,325
Accrued expenses and other (22,951) (18,549) (25,243) (33,313)
Accrual for customers' right of return 727 5,448 11,121 14,677
Income taxes payable (950) 126,708 5,875 7,754
Total adjustments 229,210 274,914 172,569 227,740
CASH PROVIDED BYOPERATING ACTIVITIES
FROM CONTINUING OPERATIONS
508,319 605,704 603,274 796,141
CASH FLOWS FROM INVESTING ACTIVITIES
Property,plant and equipment:
• Additions (116,626) (220,016) (272,180) (359,196)
•Disposals 198 1,022 21,563 28,457
Increase in investments (5,872) (7,750)
Purchases of businesses net of cash acquired (362,978) (86,966) (134,114) (176,990)
Sale of investment in Pearle Europe 144,000
Sale of Things Remembered 128,007 168,931
Additions of intangible assets (301) (4,479) (1,140) (1,505)
CASH USED IN INVESTING ACTIVITIES OF CONTINUING OPERATIONS (479,707) (166,439) (263,737) (348,053)
(cont’d)
STATEMENTS
OF CONSOLIDATED
CASH FLOWS
THE YEARS ENDED
DECEMBER 31, 2004,
2005 AND 2006 (*)