LensCrafters 2006 Annual Report Download - page 55
Download and view the complete annual report
Please find page 55 of the 2006 LensCrafters annual report below. You can navigate through the pages in the report by either clicking on the pages listed below, or by using the keyword search tool below to find specific information within the annual report.-
 1
1 -
2
-
3
-
4
-
5
-
6
-
7
-
8
-
9
-
10
-
11
-
12
-
13
-
14
-
15
-
16
-
17
-
18
-
19
-
20
-
21
-
22
-
23
-
24
-
25
-
26
-
27
-
28
-
29
-
30
-
31
-
32
-
33
-
34
-
35
-
36
-
37
-
38
-
39
-
40
-
41
-
42
-
43
-
44
-
 45
45 -
 46
46 -
 47
47 -
 48
48 -
 49
49 -
 50
50 -
 51
51 -
 52
52 -
 53
53 -
 54
54 -
 55
55 -
 56
56 -
 57
57 -
 58
58 -
 59
59 -
 60
60 -
 61
61 -
 62
62 -
 63
63 -
 64
64 -
 65
65 -
66
-
67
-
68
-
69
-
70
-
71
-
72
-
73
-
74
-
75
-
76
-
77
-
78
-
79
-
80
-
81
-
82
-
83
-
84
-
85
-
86
-
87
-
88
-
89
-
90
-
91
-
92
-
93
-
94
-
95
-
96
-
97
-
98
-
99
-
100
-
101
-
102
-
103
-
104
-
105
-
106
-
107
-
108
-
109
-
110
-
111
-
112
-
113
-
114
-
115
-
116
-
117
-
118
-
119
-
120
-
121
-
122
-
123
-
124
-
125
-
126
-
127
-
128
-
129
-
130
-
131
-
132
-
133
-
134
-
135
-
136
-
137
-
138
-
139
-
140
-
141
-
142
-
143
-
144
-
145
-
146
-
147
-
148
-
149
-
150
-
151
-
152
-
153
-
154
-
155
-
156
-
157
-
158
-
159
-
160
-
161
-
162
-
163
-
164
-
165
-
166
 |
 |

|55 <
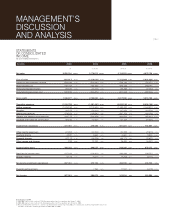
MANAGEMENT’S
DISCUSSION
AND ANALYSIS
According to U.S. GAAP
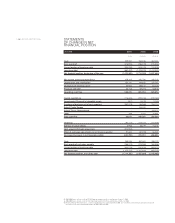
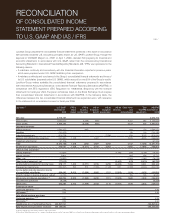
(1) 2003-2006 figures include results of OPSM Group operations from the acquisition date (August 1, 2003).
(2) 2004-2006 figures include results of Cole National operations from the acquisition date (October 4, 2004).
(3) Results of Things Remembered, Inc., a former subsidiary that was sold in September 2006, are reclassified as discontinued operations and are not
included in results from continuing operations for 2004, 2005 and 2006.
STATEMENTS
OF CONSOLIDATED
INCOME
(for years ended December 31)
(Euro/000) 2003 2004 2005 2006
(1) (1) (2) (3) (1) (2) (3) (1) (2) (3)
Net sales 2,852,194 100.0% 3,179,613 100.0% 4,134,263 100.0% 4,676,156 100.0%
Cost of sales (903,617) 31.7% (1,018,633) 32.0% (1,316,664) 31.8% (1,426,000) 30.5%
Purchases and inventory variance (506,335) 17.8% (552,560) 17.4% (758,116) 18.3% (731,577) 15.6%
Manufacturing cost (134,037) 4.7% (186,455) 5.9% (228,448) 5.5% (288,091) 6.2%
Manufacturing depreciation (22,320) 0.8% (22,742) 0.7% (28,788) 0.7% (47,127) 1.0%
Manufacturing personnel cost (240,925) 8.4% (256,876) 8.1% (301,313) 7.3% (359,205) 7.7%
Gross profit 1,948,577 68.3% 2,160,980 68.0% 2,817,598 68.2% 3,250,156 69.5%
Operating expenses (1,516,790) 53.2% (1,681,481) 52.9% (2,236,198) 54.1% (2,494,169) 53.3%
Selling expenses (1,015,918) 35.6% (1,102,400) 34.7% (1,439,437) 34.8% (1,544,327) 33.0%
Royalties (41,537) 1.5% (51,002) 1.6% (67,050) 1.6% (104,579) 2.2%
Advertising expenses (178,303) 6.3% (189,580) 6.0% (267,753) 6.5% (318,128) 6.8%
General and administrative expenses (243,717) 8.5% (293,838) 9.2% (409,820) 9.9% (465,830) 10.0%
Goodwill and trademark amortization (37,316) 1.3% (44,661) 1.4% (52,137) 1.3% (61,306) 1.3%
Income from operations 431,787 15.1% 479,499 15.1% 581,401 14.1% 755,987 16.2%
Other income/(expenses) (41,994) 1.5% (34,924) 1.1% (42,092) 1.0% (77,810) 1.7%
Financial income 5,922 0.2% 6,662 0.2% 5,650 0.1% 9,804 0.2%
Financial charges (47,117) 1.7% (55,378) 1.7% (66,171) 1.6% (70,622) 1.5%
Other income and charges (799) 0,0% 13,792 0.4% 18,429 0.4% (16,992) 0.4%
Income before taxes 389,793 13.7% 444,575 14.0% 539.309 13.0% 678,177 14.5%
Provision for income taxes (117,328) 4.1% (156,852) 4.9% (199,266) 4.8% (238,757) 5.1%
Minority interests (5,122) 0.2% (8,614) 0.3% (9,253) 0.2% (8,715) 0.2%
Net income (continuing operations) 267,343 9.4% 279,109 8.8% 330,790 8.0% 430,705 9.2%
Discontinued operations 7,765 0.2% 11,504 0.3% (6,419) 0.1%
Net income 267,343 9.4% 286,874 9.0% 342,294 8.3% 424,286 9.1%