LensCrafters 2006 Annual Report Download - page 14
Download and view the complete annual report
Please find page 14 of the 2006 LensCrafters annual report below. You can navigate through the pages in the report by either clicking on the pages listed below, or by using the keyword search tool below to find specific information within the annual report.-
 1
1 -
2
-
3
-
 4
4 -
 5
5 -
 6
6 -
 7
7 -
 8
8 -
 9
9 -
 10
10 -
 11
11 -
 12
12 -
 13
13 -
 14
14 -
 15
15 -
 16
16 -
 17
17 -
 18
18 -
 19
19 -
 20
20 -
 21
21 -
 22
22 -
 23
23 -
 24
24 -
25
-
26
-
27
-
28
-
29
-
30
-
31
-
32
-
33
-
34
-
35
-
36
-
37
-
38
-
39
-
40
-
41
-
42
-
43
-
44
-
45
-
46
-
47
-
48
-
49
-
50
-
51
-
52
-
53
-
54
-
55
-
56
-
57
-
58
-
59
-
60
-
61
-
62
-
63
-
64
-
65
-
66
-
67
-
68
-
69
-
70
-
71
-
72
-
73
-
74
-
75
-
76
-
77
-
78
-
79
-
80
-
81
-
82
-
83
-
84
-
85
-
86
-
87
-
88
-
89
-
90
-
91
-
92
-
93
-
94
-
95
-
96
-
97
-
98
-
99
-
100
-
101
-
102
-
103
-
104
-
105
-
106
-
107
-
108
-
109
-
110
-
111
-
112
-
113
-
114
-
115
-
116
-
117
-
118
-
119
-
120
-
121
-
122
-
123
-
124
-
125
-
126
-
127
-
128
-
129
-
130
-
131
-
132
-
133
-
134
-
135
-
136
-
137
-
138
-
139
-
140
-
141
-
142
-
143
-
144
-
145
-
146
-
147
-
148
-
149
-
150
-
151
-
152
-
153
-
154
-
155
-
156
-
157
-
158
-
159
-
160
-
161
-
162
-
163
-
164
-
165
-
166
 |
 |

2006
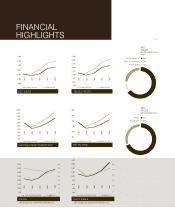
FINANCIAL HIGHLIGHTS 2002-2006
(Euro/000) (1) (3) First quarter Second quarter Third quarter Fourth quarter
Net sales 1,217,923 100.0% 1,227,300 100.0% 1,120,380 100.0% 1,110,553 100.0%
Gross profit 832,023 68.3% 852,881 69.5% 790,118 70.5% 775,133 69.8%
Income from operations 196,737 16.2% 207,845 16.9% 186,480 16.6% 164,924 14.9%
Income before taxes 176,048 14.5% 186,649 15.2% 167,665 15.0% 147,815 13.3%
Net income from continuing operations 106,630 8.8% 116,291 9.5% 107,041 9.6% 100,743 9.1%
Discontinued operations (3,381) 0.3% 4,931 0.4% (2,915) 0.3% (5,054) 0.5%
Net income 103,249 8.5% 121,222 9.9% 104,126 9.3% 95,689 8.6%
Net earnings (continuing operations) per share (Euro) 0.24 0.26 0.24 0.22
per ADS (US$) (2) 0.29 0.32 0.30 0.29
Net earnings per share (Euro) 0.23 0.27 0.23 0.21
per ADS (US$) (2) 0.28 0.34 0.29 0.27
2005
(Euro/000) (1) (3) First quarter Second quarter Third quarter Fourth quarter
Net sales 998,859 100.0% 1,079,511 100.0% 1,020,629 100.0% 1,035,264 100.0%
Gross profit 674,696 67.5% 733,018 67.9% 711,040 69.7% 698,844 67.5%
Income from operations 141,491 14.2% 155,875 14.4% 154,810 15.2% 129,225 12.5%
Income before taxes 134,024 13.4% 143,249 13.3% 139,285 13.6% 122,750 11.9%
Net income from continuing operations 83,106 8.3% 81,819 7.6% 89,753 8.8% 76,112 7.4%
Discontinued operations (6,768) 0.7% 9,248 0.9% (444) 0.0% 9,468 0.9%
Net income 76,338 7.6% 91,067 8.4% 89,309 8.8% 85,580 8.3%
Net earnings (continuing operations) per share (Euro) 0.18 0.18 0.20 0.17
per ADS (in US$) (2) 0.24 0.23 0.24 0.20
Net earnings per share (Euro) 0.17 0.20 0.20 0.19
per ADS (in US$) (2) 0.22 0.25 0.24 0.23
QUARTERLY RESULTS 2005-2006
(Subject to limited audit review)
(Euro/000) 2002 2003 2004 2005 2006
(US$/000) (3) (3) (4) (5) (3) (4) (5) (3) (4) (5)
Net sales 3,201,788 100.0% 2,852,194 100.0% 3,179,613 100.0% 4,134,263 100.0% 4,676,156 100.0%
3,025,690 3,224,976 3,953,849 5,144,602 5,870,208
Gross profit 2,255,654 70.4% 1,948,577 68.3% 2,160,980 68.0% 2,817,598 68.2% 3,250,156 69.5%
2,131,593 2,203,256 2,687,178 3,506,169 4,080,080
Income from operations 601,508 18.8% 431,787 15.1% 479,499 15.1% 581,401 14.1% 755,987 16.2%
568,425 488,222 596,257 723,484 949,027
Income before taxes 539,442 16.8% 389,793 13.7% 444,575 14.0% 539,309 13.0% 678,177 14.5%
509,772 440,739 552,829 671,106 851,348
Net income from continuing operations 372,077 11.6% 267,343 9.4% 279,109 8.8% 330,790 8.0% 430,705 9.2%
351,613 302,285 347,073 411,629 540,685
Discontinued operations - - 7,765 0.2% 11,504 0.3% (6,419) 0.1%
- - 9,655 14,315 (8,058)
Net income 372,077 11.6% 267,343 9.4% 286,874 9.0% 342,294 8.3% 424,286 9.1%
351,613 302,285 356,728 425,945 532,626
Net earnings (continuing operations) per share (Euro) 0.82 0.60 0.62 0.73 0.95
per ADS (US$) (1) 0.78 0.67 0.77 0.91 1.19
Net earnings per share (Euro) 0.82 0.60 0.64 0.76 0.94
per ADS (US$) (1) 0.78 0.67 0.80 0.95 1.18
Dividend per share (Euro) (2) 0.210 0.210 0.230 0.290 0.420
per ADS (US$) (1)(2) 0.242 0.256 0.277 0.365 n.a.
Average number of outstanding shares 453,174,041 448,664,413 448,275,028 450,179,073 452,897,854
In accordance to U.S. GAAP
(1) 1 ADS = 1 ordinary share. (2) Proposed by the Board of Directors and to be submitted for approval at the Annual Shareholders’ Ordinary Meeting on May 15, 2007. (3) Figures include results of OPSM Group operations from the
acquisition date (August 1, 2003). (4) Figures include results of Cole National operations from the acquisition date (October 4, 2004). (5) Results of Things Remembered, Inc., a former subsidiary that was sold in September 2006, are
reclassified as discontinued operations and are not included in results from continuing operations for 2004, 2005 and 2006.
In accordance to U.S. GAAP
(1) Except for per share and ADS data, which are in Euro and US$. (2) All amounts in US$ were translated at the average Euro/US$ exchange rate for the period in reference. See page 93. (3) Results of Things Remembered, Inc., a former
subsidiary that was sold in September 2006, are reclassified as discontinued operations and are not included in results from continuing operations for 2005 and 2006.