LensCrafters 2006 Annual Report Download - page 58
Download and view the complete annual report
Please find page 58 of the 2006 LensCrafters annual report below. You can navigate through the pages in the report by either clicking on the pages listed below, or by using the keyword search tool below to find specific information within the annual report.-
 1
1 -
2
-
3
-
4
-
5
-
6
-
7
-
8
-
9
-
10
-
11
-
12
-
13
-
14
-
15
-
16
-
17
-
18
-
19
-
20
-
21
-
22
-
23
-
24
-
25
-
26
-
27
-
28
-
29
-
30
-
31
-
32
-
33
-
34
-
35
-
36
-
37
-
38
-
39
-
40
-
41
-
42
-
43
-
44
-
45
-
46
-
47
-
 48
48 -
 49
49 -
 50
50 -
 51
51 -
 52
52 -
 53
53 -
 54
54 -
 55
55 -
 56
56 -
 57
57 -
 58
58 -
 59
59 -
 60
60 -
 61
61 -
 62
62 -
 63
63 -
 64
64 -
 65
65 -
 66
66 -
 67
67 -
 68
68 -
69
-
70
-
71
-
72
-
73
-
74
-
75
-
76
-
77
-
78
-
79
-
80
-
81
-
82
-
83
-
84
-
85
-
86
-
87
-
88
-
89
-
90
-
91
-
92
-
93
-
94
-
95
-
96
-
97
-
98
-
99
-
100
-
101
-
102
-
103
-
104
-
105
-
106
-
107
-
108
-
109
-
110
-
111
-
112
-
113
-
114
-
115
-
116
-
117
-
118
-
119
-
120
-
121
-
122
-
123
-
124
-
125
-
126
-
127
-
128
-
129
-
130
-
131
-
132
-
133
-
134
-
135
-
136
-
137
-
138
-
139
-
140
-
141
-
142
-
143
-
144
-
145
-
146
-
147
-
148
-
149
-
150
-
151
-
152
-
153
-
154
-
155
-
156
-
157
-
158
-
159
-
160
-
161
-
162
-
163
-
164
-
165
-
166
 |
 |
>58 | ANNUAL REPORT 2006
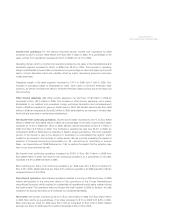
On a geographical basis, combined retail and manufacturing and wholesale operations in the
United States and Canada resulted in net sales of Euro 3,076.4 million in 2006, comprising 65.8%
of total net sales and an increase of Euro 264.5 million or 9.4% as compared to 2005. Net sales for
operations in Asia-Pacific were Euro 498.4 million during 2006 as compared to Euro 461.2 million
in 2005, which represented an 8.1% increase in net sales. Net sales for the rest of the world
accounted for the remaining Euro 1,101.4 million of net sales during 2006, which represented a
27.9% increase in net sales as compared to 2005. The increase in the rest of the world was
primarily attributable to strong performance in almost all major European markets that led to an
increase in sales of Euro 190.4 million in 2006 as compared to 2005.
During 2006, net sales in the retail segment accounted for approximately 70.4% of total net sales,
as compared to approximately 74.0% of net sales in 2005. This decrease in retail net sales as a
percentage of total net sales is attributable to a significant increase in net sales to third parties in
our manufacturing and wholesale segment, which grew by 28.6% in 2006.
Cost of sales. Cost of sales increased by 8.3% to Euro 1,426.0 million in 2006, from Euro 1,316.7
million in 2005, primarily attributable to our overall sales growth. As a percentage of net sales, cost of
sales decreased to 30.5% from 31.8%. This decrease as a percentage of net sales was primarily
attributable to the change in sales mix resulting from increased sales of our Ray-Ban brand and sales
of branded products of our designer lines, Prada, Bvlgari and Dolce & Gabbana, which carry a higher
gross margin than other lines, increased efficiency in our manufacturing facilities leveraging the fixed
cost structure to produce more frames, and increased production to cover the additional demand for
our products. In 2006, the average number of frames produced daily in Luxottica’s facilities was
approximately 153,000 as compared to 115,000 for the same period of 2005, attributable to increased
production in the Tristar facility, as well as improved productivity in our Italian factories.
Gross profit. For the reasons described above, gross profit increased by 15.4% to Euro 3,250.2
million in 2006 from Euro 2,817.6 million in 2005. As a percentage of net sales, gross profit increased
to 69.5% in 2006 from 68.2% in 2005, primarily due to the increase in gross profit of the
manufacturing and wholesale segment.
Operating expenses. Total operating expenses increased by 11.5% to Euro 2,494.2 million in 2006
from Euro 2,236.2 million in 2005. As a percentage of net sales, operating expenses decreased to
53.3% in 2006 from 54.1% in 2005 primarily attributable to the increase in net sales while maintaining
strong cost controls in both our manufacturing and wholesale and our retail segments.
Selling and advertising expenses (including royalty expenses) increased by 10.9% to Euro 1,967.0
million in 2006, from Euro 1,774.2 million in 2005, primarily due to increased net sales. As a
percentage of net sales, selling and advertising expenses decreased to 42.1% in 2006 from 42.9%
in 2005, primarily attributable to a reduced commissions percentage relative to sales earned by the
wholesale sales force and to lower store costs in the North American retail business leveraging the
fixed cost store structure by an increase in same store sales. As we integrate the newly acquired
stores in both Canada and China, we expect to further realize a reduction in selling expenses as a
percentage of sales.
General and administrative expenses, including intangible asset amortization, increased by 14.1%
to Euro 527.1 million in 2006 from Euro 462.0 million in 2005. This includes approximately
Euro 48.0 million of expense relating to stock options expensed in accordance with SFAS no.
123(R), which the Company adopted on January 1, 2006, as compared to Euro 21.0 million in
2005 (calculated according to APB 25). As a percentage of net sales, general and administrative
expenses increased to 11.3% in 2006 from 11.2% in 2005.