LensCrafters 2006 Annual Report Download - page 15
Download and view the complete annual report
Please find page 15 of the 2006 LensCrafters annual report below. You can navigate through the pages in the report by either clicking on the pages listed below, or by using the keyword search tool below to find specific information within the annual report.-
 1
1 -
2
-
3
-
4
-
 5
5 -
 6
6 -
 7
7 -
 8
8 -
 9
9 -
 10
10 -
 11
11 -
 12
12 -
 13
13 -
 14
14 -
 15
15 -
 16
16 -
 17
17 -
 18
18 -
 19
19 -
 20
20 -
 21
21 -
 22
22 -
 23
23 -
 24
24 -
 25
25 -
26
-
27
-
28
-
29
-
30
-
31
-
32
-
33
-
34
-
35
-
36
-
37
-
38
-
39
-
40
-
41
-
42
-
43
-
44
-
45
-
46
-
47
-
48
-
49
-
50
-
51
-
52
-
53
-
54
-
55
-
56
-
57
-
58
-
59
-
60
-
61
-
62
-
63
-
64
-
65
-
66
-
67
-
68
-
69
-
70
-
71
-
72
-
73
-
74
-
75
-
76
-
77
-
78
-
79
-
80
-
81
-
82
-
83
-
84
-
85
-
86
-
87
-
88
-
89
-
90
-
91
-
92
-
93
-
94
-
95
-
96
-
97
-
98
-
99
-
100
-
101
-
102
-
103
-
104
-
105
-
106
-
107
-
108
-
109
-
110
-
111
-
112
-
113
-
114
-
115
-
116
-
117
-
118
-
119
-
120
-
121
-
122
-
123
-
124
-
125
-
126
-
127
-
128
-
129
-
130
-
131
-
132
-
133
-
134
-
135
-
136
-
137
-
138
-
139
-
140
-
141
-
142
-
143
-
144
-
145
-
146
-
147
-
148
-
149
-
150
-
151
-
152
-
153
-
154
-
155
-
156
-
157
-
158
-
159
-
160
-
161
-
162
-
163
-
164
-
165
-
166
 |
 |

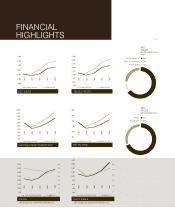
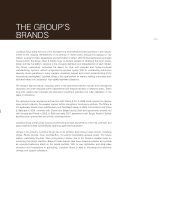
FINANCIAL
HIGHLIGHTS
200
400
800
1,000
1,200
1,400
1,600
5%
10%
15%
20%
25%
30%
2002
2003
2004
2005
2006
margin in %sales (millions of Euro)
600
WHOLESALE
margin in %sales (millions of Euro)
2002
2003
2004
2005
2006
500
1,000
2,000
2,500
3,000
3,500
4,000
4%
6%
8%
10%
14%
16%
1,500
2%
12%
RETAIL
NET SALES AND OPERATING MARGIN IN % NET SALES AND OPERATING MARGIN IN %
1,800
100
400
500
600
2002
2003
2004
2005
2006
millions of US$millions of Euro
300
200
NET INCOME
100
200
400
500
600
700
800
900
1,000
2002
2003
2004
2005
2006
millions of US$millions of Euro
300
INCOME FROM OPERATIONS
1,000
2,000
3,000
5,000
6,000
7,000
2002
2003
2004
2005
2006
millions of US$millions of Euro
2002
2003
2004
2005
2006
millions of US$millions of Euro
500
1,500
2,000
2,500
3,000
3,500
4,000
4,500
4,000
1,000
NET SALES GROSS PROFIT
NET
SALES
BY GEOGRAPHICAL
AREA
66%
23%
11%
North America
Rest of the world
Asia-Pacific
NET
SALES
BY DISTRIBUTION
70%
30%
Retail
Wholesale
|15<