LensCrafters 2006 Annual Report Download - page 107
Download and view the complete annual report
Please find page 107 of the 2006 LensCrafters annual report below. You can navigate through the pages in the report by either clicking on the pages listed below, or by using the keyword search tool below to find specific information within the annual report.-
 1
1 -
2
-
3
-
4
-
5
-
6
-
7
-
8
-
9
-
10
-
11
-
12
-
13
-
14
-
15
-
16
-
17
-
18
-
19
-
20
-
21
-
22
-
23
-
24
-
25
-
26
-
27
-
28
-
29
-
30
-
31
-
32
-
33
-
34
-
35
-
36
-
37
-
38
-
39
-
40
-
41
-
42
-
43
-
44
-
45
-
46
-
47
-
48
-
49
-
50
-
51
-
52
-
53
-
54
-
55
-
56
-
57
-
58
-
59
-
60
-
61
-
62
-
63
-
64
-
65
-
66
-
67
-
68
-
69
-
70
-
71
-
72
-
73
-
74
-
75
-
76
-
77
-
78
-
79
-
80
-
81
-
82
-
83
-
84
-
85
-
86
-
87
-
88
-
89
-
90
-
91
-
92
-
93
-
94
-
95
-
96
-
 97
97 -
 98
98 -
 99
99 -
 100
100 -
 101
101 -
 102
102 -
 103
103 -
 104
104 -
 105
105 -
 106
106 -
 107
107 -
 108
108 -
 109
109 -
 110
110 -
 111
111 -
 112
112 -
 113
113 -
 114
114 -
 115
115 -
 116
116 -
 117
117 -
118
-
119
-
120
-
121
-
122
-
123
-
124
-
125
-
126
-
127
-
128
-
129
-
130
-
131
-
132
-
133
-
134
-
135
-
136
-
137
-
138
-
139
-
140
-
141
-
142
-
143
-
144
-
145
-
146
-
147
-
148
-
149
-
150
-
151
-
152
-
153
-
154
-
155
-
156
-
157
-
158
-
159
-
160
-
161
-
162
-
163
-
164
-
165
-
166
 |
 |

REPORT OF
INDEPENDENT REGISTERED
PUBLIC ACCOUNTING FIRM |107 <
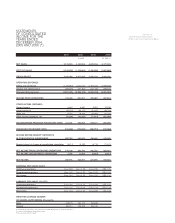
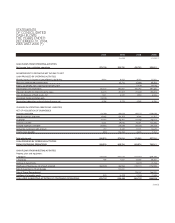
2004 2005 2006 2006
(cont’d) (Euro/000) (US$/000) (1)
CASH FLOWS FROM FINANCING ACTIVITIES
Long-term debt:
•Proceeds 1,187,601 373,462 84,100 110,987
• Repayments (918,564) (623,338) (233,378) (307,989)
Swap termination fees (7,062)
Decrease in overdraft balances (248,404) (17,813) (101,008) (133,303)
Exercise of stock options 5,993 28,229 24,443 32,257
Excess tax benefit from stock-based compensation (7,279) (9,606)
Dividends (94,113) (103,484) (131,369) (173,368)
CASH USED IN FINANCING ACTIVITIES OF CONTINUING OPERATIONS (67,487) (350,006) (349,933) (461,807)
(DECREASE) INCREASE IN CASH AND CASH EQUIVALENTS (38,875) 89,260 (10,395) (13,719)
CASH AND EQUIVALENTS, BEGINNING OF YEAR 299,937 253,246 367,461 484,938
Effect of exchange rate changes on cash and cash equivalents (7,816) 24,955 (17,944) (23,681)
CASH AND EQUIVALENTS, END OF YEAR 253,246 367,461 339,122 447,539
Cash provided by (used in) operating activities of discontinued operations 20,359 17,756 (5,688) (7,507)
Cash provided by (used in) investing activities of discontinued operations (794) (9,340) (9,186) (12,123)
Cash provided by (used in) financing activities of discontinued operations (15,155) (8,318) 16,209 21,391
(DECREASE)INCREASE IN CASH AND CASH EQUIVALENTS OF DISCONTINUED OPERATIONS 4,409 99 1,334 1,761
CASH RECLASSIFIED AS ASSETS OF DISCONTINUED OPERATIONS AT BEGINNING OF YEAR 4,103 4,795 6,328
EFFECT OF TRANSLATION ADJUSTMENTS ON CASH AND CASH EQUIVALENTS
OF DISCONTINUED OPERATIONS (306) 593 (557) (736)
CASH RETAINED BY DISCONTINUED OPERATIONS UPON SALE (5,572) (7,353)
CASH INCLUDED IN ASSETS OF DISCONTINUED OPERATIONS ATEND OF PERIOD 4,103 4,795
SUPPLEMENTAL DISCLOSURE OF CASH FLOWS INFORMATION:
Cash paid during the year for interest 58,371 61,770 67,496 89,074
Cash paid during the year for income taxes 108,440 153,287 242,628 320,196
Acquisition of businesses:
•Fair value of assets acquired 157,905 3,702 10,863 14,336
(1) Translated for convenience at the New York City Noon Buying Rate as determined in Note 1
See notes to Consolidated Financial Statements.
(*) In accordance with U.S. GAAP.