LensCrafters 2006 Annual Report Download - page 150
Download and view the complete annual report
Please find page 150 of the 2006 LensCrafters annual report below. You can navigate through the pages in the report by either clicking on the pages listed below, or by using the keyword search tool below to find specific information within the annual report.-
 1
1 -
2
-
3
-
4
-
5
-
6
-
7
-
8
-
9
-
10
-
11
-
12
-
13
-
14
-
15
-
16
-
17
-
18
-
19
-
20
-
21
-
22
-
23
-
24
-
25
-
26
-
27
-
28
-
29
-
30
-
31
-
32
-
33
-
34
-
35
-
36
-
37
-
38
-
39
-
40
-
41
-
42
-
43
-
44
-
45
-
46
-
47
-
48
-
49
-
50
-
51
-
52
-
53
-
54
-
55
-
56
-
57
-
58
-
59
-
60
-
61
-
62
-
63
-
64
-
65
-
66
-
67
-
68
-
69
-
70
-
71
-
72
-
73
-
74
-
75
-
76
-
77
-
78
-
79
-
80
-
81
-
82
-
83
-
84
-
85
-
86
-
87
-
88
-
89
-
90
-
91
-
92
-
93
-
94
-
95
-
96
-
97
-
98
-
99
-
100
-
101
-
102
-
103
-
104
-
105
-
106
-
107
-
108
-
109
-
110
-
111
-
112
-
113
-
114
-
115
-
116
-
117
-
118
-
119
-
120
-
121
-
122
-
123
-
124
-
125
-
126
-
127
-
128
-
129
-
130
-
131
-
132
-
133
-
134
-
135
-
136
-
137
-
138
-
139
-
 140
140 -
 141
141 -
 142
142 -
 143
143 -
 144
144 -
 145
145 -
 146
146 -
 147
147 -
 148
148 -
 149
149 -
 150
150 -
 151
151 -
 152
152 -
 153
153 -
 154
154 -
 155
155 -
 156
156 -
 157
157 -
 158
158 -
 159
159 -
 160
160 -
161
-
162
-
163
-
164
-
165
-
166
 |
 |

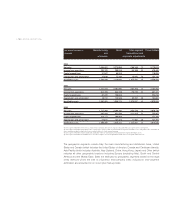
Year ended December 31, Manufacturing Retail Inter-segment Consolidated
(Euro/000) and transactions and
wholesale corporate adjustments
2004
Net sales 1,094,802 2,270,996 (186,185) (1) 3,179,613
Income from operations 233,129 296,538 (50,168) (2) 479,499
Capital expenditures 31,367 85,259 - 116,626
Depreciation and amortization 47,656 77,439 25,045 (3) 150,140
Identifiable assets 1,566,086 1,114,680 1,875,292 (4) 4,556,058
2005
Net sales 1,310,273 3,061,690 (237,700) (1) 4,134,263
Income from operations 304,333 355,238 (78,170) (2) 581,401
Capital expenditures 81,070 138,946 -220,016
Depreciation and amortization 48,720 103,596 32,337 (3) 184,652
Identifiable assets 1,590,091 1,308,174 2,075,257 (4) 4,973,522
2006
Net sales 1,715,369 3,294,160 (333,374) (1) 4,676,156
Income from operations 445,843 431,546 (121,403) (2) 755,987
Capital expenditures 108,117 164,063 -272,180
Depreciation and amortization 57,331 122,403 41,063 (3) 220,797
Identifiable assets 1,799,292 1,343,481 1,772,252 (4) 4,915,025
(1) Inter-segment elimination of net revenues relates to intercompany sales from the manufacturing and wholesale segment to the retail segment.
(2) Inter-segment elimination of operating income mainly relates to depreciation and amortization of corporate identifiable assets and profit-in-stock elimination for
frames manufactured by the wholesale business and included in the retail segment inventory.
(3) Inter-segment elimination of depreciation and amortization relates to depreciation and amortization of corporate identifiable assets.
(4) Inter-segment elimination of identifiable assets includes mainly the net value of goodwill and trade names of acquired retail businesses.
The geographic segments include Italy, the main manufacturing and distribution base, United
States and Canada (which includes the United States of America, Canada and Caribbean islands),
Asia Pacific (which includes Australia, New Zealand, China, Hong Kong, Japan) and Other (which
includes all other geographic locations including Europe (excluding Italy), South and Central
America and the Middle East). Sales are attributed to geographic segments based on the legal
entity domicile where the sale is originated. Intercompany sales included in inter-segment
elimination are accounted for on a cost plus mark-up basis.
>150 | ANNUAL REPORT 2006