LensCrafters 2005 Annual Report Download - page 65
Download and view the complete annual report
Please find page 65 of the 2005 LensCrafters annual report below. You can navigate through the pages in the report by either clicking on the pages listed below, or by using the keyword search tool below to find specific information within the annual report.-
 1
1 -
2
-
3
-
4
-
5
-
6
-
7
-
8
-
9
-
10
-
11
-
12
-
13
-
14
-
15
-
16
-
17
-
18
-
19
-
20
-
21
-
22
-
23
-
24
-
25
-
26
-
27
-
28
-
29
-
30
-
31
-
32
-
33
-
34
-
35
-
36
-
37
-
38
-
39
-
40
-
41
-
42
-
43
-
44
-
45
-
46
-
47
-
48
-
49
-
50
-
51
-
52
-
53
-
54
-
 55
55 -
 56
56 -
 57
57 -
 58
58 -
 59
59 -
 60
60 -
 61
61 -
 62
62 -
 63
63 -
 64
64 -
 65
65 -
 66
66 -
 67
67 -
 68
68 -
 69
69 -
 70
70 -
 71
71 -
 72
72 -
 73
73 -
 74
74 -
 75
75 -
76
-
77
-
78
-
79
-
80
-
81
-
82
-
83
-
84
-
85
-
86
-
87
-
88
-
89
-
90
-
91
-
92
-
93
-
94
-
95
-
96
-
97
-
98
-
99
-
100
-
101
-
102
-
103
-
104
-
105
-
106
-
107
-
108
-
109
-
110
-
111
-
112
-
113
-
114
-
115
-
116
-
117
-
118
-
119
-
120
-
121
-
122
-
123
-
124
-
125
-
126
-
127
-
128
-
129
-
130
-
131
-
132
-
133
-
134
-
135
-
136
-
137
-
138
-
139
-
140
-
141
-
142
-
143
-
144
-
145
-
146
-
147
-
148
-
149
-
150
-
151
-
152
-
153
-
154
-
155
-
156
-
157
-
158
 |
 |
> 64 | ANNUAL REPORT 2005
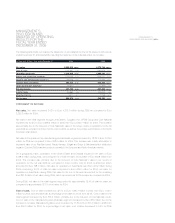
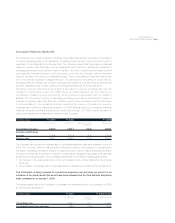
from 7.9% for 2004. Both for 2004 and 2005, the average number of frames produced daily in Luxottica
Group’s facilities was approximately 125,000.
Gross profit. For the reasons outlined above, gross profit increased by 35.0% to Euro 2,990.1 million
in 2005 from Euro 2,214.6 million for 2004. As a percentage of net sales, gross profit increased to
68.4% in 2005 from 68.0% for 2004 due to improved gross margin in our wholesale division.
Operating expenses. Total operating expenses increased by 38.7% to Euro 2,387.5 million in 2005
from Euro 1,721.8 million for 2004. As a percentage of net sales, operating expenses increased to
54.6% in 2005 from 52.9% for 2004, due to the inclusion of Cole National results.
Selling and advertising expenses (including royalty expenses) increased by 38.7% to Euro 1,909.7 million
during 2005, from Euro 1,376.5 million for 2004. Euro 399.3 million of this increase is attributable to the
inclusion of Cole National in the Group results of operations. As a percentage of net sales, selling and
advertising expenses increased to 43.7% in 2005 from 42.3% for 2004. This increase as a percentage of
sales is primarily attributable to the consolidation of Cole National’s results in the Group results of operations.
General and administrative expenses, including intangible asset amortization, increased by 38.4% to
Euro 477.8 million in 2005 from Euro 345.2 million for 2004. Euro 90.1 million of this increase is
attributable to the inclusion of Cole National in the Group results of operations. As a percentage of net
sales, general and administrative expenses increased to 10.9% in 2005 from 10.6% for 2004. The
restructuring of Cole National operations is complete and it is expected that the general and
administrative costs of the Group will decrease as a percentage of sales during 2006.
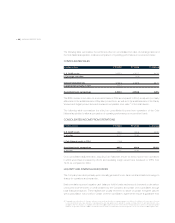
Income from operations. Income from operations for 2005 increased by 22.3% to Euro 602.6 million,
from Euro 492.8 million for 2004. As a percentage of net sales, income from operations decreased to
13.8% in 2005 from 15.1% for 2004.
Operating margin in the manufacturing and wholesale distribution segment increased to 23.2% in 2005
from 21.3% for 2004. This increase in operating margin is attributable to lower sales commissions and
higher gross profit due to a more favorable product mix, partially offset by higher advertising expenses
(including royalty expenses).
Operating margin in the retail segment decreased to 11.5% in 2005 from 13.2% for 2004 due to the inclusion
of Cole National’s results in the Group results of operations. Management expects that the North American
retail operating margin levels will return to 2004 pre-acquisition operating margin levels by the end of 2006.
Other income (expense) - net. Other income (expense) - net was Euro (45.0) million in 2005 as
compared to Euro (35.7) million for 2004. This increase in other income (expense) - net is mainly
attributable to higher interest expenses incurred to finance a higher net debt following Cole National’s
acquisition in October 2004.
Net income. Income before taxes increased by 22.0% to Euro 557.6 million in 2005 from Euro 457.2
million for 2004. As a percentage of net sales, income before taxes decreased to 12.8% in 2005, from
14.0% for 2004. Minority interest increased to Euro (9.3) million in 2005 from Euro (8.6) million for 2004.
The Company’s effective tax rate was 37.0% in 2005, while it was 35.4% for 2004. Net income
increased by 19.3% to Euro 342.3 million in 2005 from Euro 286.9 million for 2004. Net income as a
percentage of net sales decreased to 7.8% in 2005 from 8.8% for 2004.
Basic and diluted earnings per share for 2005 were Euro 0.76, as compared to Euro 0.64 (both basic
and diluted) for 2004.