LensCrafters 2005 Annual Report Download - page 64
Download and view the complete annual report
Please find page 64 of the 2005 LensCrafters annual report below. You can navigate through the pages in the report by either clicking on the pages listed below, or by using the keyword search tool below to find specific information within the annual report.-
 1
1 -
2
-
3
-
4
-
5
-
6
-
7
-
8
-
9
-
10
-
11
-
12
-
13
-
14
-
15
-
16
-
17
-
18
-
19
-
20
-
21
-
22
-
23
-
24
-
25
-
26
-
27
-
28
-
29
-
30
-
31
-
32
-
33
-
34
-
35
-
36
-
37
-
38
-
39
-
40
-
41
-
42
-
43
-
44
-
45
-
46
-
47
-
48
-
49
-
50
-
51
-
52
-
53
-
 54
54 -
 55
55 -
 56
56 -
 57
57 -
 58
58 -
 59
59 -
 60
60 -
 61
61 -
 62
62 -
 63
63 -
 64
64 -
 65
65 -
 66
66 -
 67
67 -
 68
68 -
 69
69 -
 70
70 -
 71
71 -
 72
72 -
 73
73 -
 74
74 -
75
-
76
-
77
-
78
-
79
-
80
-
81
-
82
-
83
-
84
-
85
-
86
-
87
-
88
-
89
-
90
-
91
-
92
-
93
-
94
-
95
-
96
-
97
-
98
-
99
-
100
-
101
-
102
-
103
-
104
-
105
-
106
-
107
-
108
-
109
-
110
-
111
-
112
-
113
-
114
-
115
-
116
-
117
-
118
-
119
-
120
-
121
-
122
-
123
-
124
-
125
-
126
-
127
-
128
-
129
-
130
-
131
-
132
-
133
-
134
-
135
-
136
-
137
-
138
-
139
-
140
-
141
-
142
-
143
-
144
-
145
-
146
-
147
-
148
-
149
-
150
-
151
-
152
-
153
-
154
-
155
-
156
-
157
-
158
 |
 |

MANAGEMENT’S
DISCUSSION AND ANALYSIS | 63 <
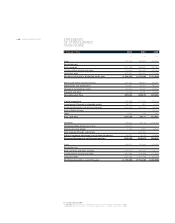
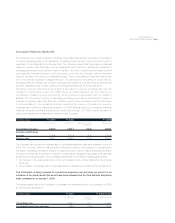
The following table briefly summarizes the statements of consolidated income for the twelve-month periods
ended December 31, 2004 and 2005, including the incidence of the individual entries on net sales:
In thousands of Euro - Year ended December 31 2004 2005
Net sales 3,255,300 100.0% 4,370,744 100.0%
Cost of sales 1,040,697 32.0% 1,380,653 31.6%
Operating expenses 2,214,603 68.0% 2,990,091 68.4%
Selling and advertising expenses 1,376,546 42.3% 1,909,747 43.7%
General and administrative expenses 345,243 10.6% 477,790 10.9%
Income from operations 492,814 15.1% 602,554 13.8%
Other income/(net expenses) (35,661) 1.1% (44,985) 1.0%
Pre-tax income 457,153 14.0% 557,569 12.8%
Income taxes 161,665 5.0% 206,022 4.7%
Minority interests 8,614 0.3% 9,253 0.2%
Net income 286,874 8.8% 342,294 7.8%
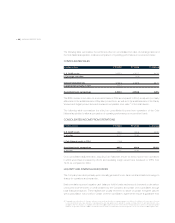
STATEMENT OF INCOME
Net sales. Net sales increased 34.3% to Euro 4,370.7 million during 2005 as compared to Euro
3,255.3 million for 2004.
Net sales in the retail segment through LensCrafters, Sunglass Hut, OPSM Group and Cole National
increased by 40.5% to Euro 3,298.2 million in 2005 from Euro 2,346.7 million for 2004. This increase
was primarily due to the inclusion of Cole National’s sales in the Group results of operations for the full
year 2005 as compared to three months only for 2004, as well as the positive performance of the North
American retail division.
Net sales to third parties in the manufacturing and wholesale segment increased by 18.3% to Euro 1,075.0
million for 2005 as compared to Euro 908.6 million for 2004. This increase was mainly attributable to
increased sales of our Ray-Ban brand, Prada, Versace, Bvlgari and Dolce & Gabbana (which distribution
began in October 2005) branded products, primarily in the European and North American markets.
On a geographic basis, operations in the United States and Canada resulted in net sales of Euro
3,048.3 million during 2005, comprising 69.7% of total net sales, an increase of Euro 964.8 million from
2004. This increase was primarily due to the inclusion of Cole National’s sales in our results of
operations for the full year 2005 as compared to three months only for 2004, a difference which
amounted to Euro 758.1 million. Net sales for operations in Asia-Pacific were Euro 461.2 million during
2005 comprising 10.6% of total net sales compared to Euro 435.0 million for 2004; net sales for
operations in Asia-Pacific during 2005. Net sales for the rest of the world accounted for the remaining
Euro 861.2 million of net sales during 2005, which represented a 16.9% increase as compared to 2004.
During 2005, net sales in the retail segment accounted for approximately 75.4% of total net sales, as
compared to approximately 72.1% of net sales for 2004.
Cost of sales. Cost of sales increased by 32.7% to Euro 1,380.7 million in 2005, from Euro 1,040.7
million for 2004, and decreased as a percentage of net sales to 31.6% from 32.0%. Cost of sales in the
retail segment increased by Euro 315.4 million, primarily due to the inclusion of Cole National results.
Cost of sales in the manufacturing and wholesale segment increased by Euro 68.6 million due to the
increase in net sales. Manufacturing labor costs increased by 17.3% to Euro 301.4 million in 2005 from
Euro 256.9 million for 2004. As a percentage of net sales, cost of labor decreased to 6.9% for 2005
MANAGEMENT’S
DISCUSSION AND
ANALYSIS OF OPERATING
RESULTS FOR THE
FISCAL YEAR ENDED
DECEMBER 31, 2005