LensCrafters 2005 Annual Report Download - page 10
Download and view the complete annual report
Please find page 10 of the 2005 LensCrafters annual report below. You can navigate through the pages in the report by either clicking on the pages listed below, or by using the keyword search tool below to find specific information within the annual report.-
 1
1 -
 2
2 -
 3
3 -
 4
4 -
 5
5 -
 6
6 -
 7
7 -
 8
8 -
 9
9 -
 10
10 -
 11
11 -
 12
12 -
 13
13 -
 14
14 -
 15
15 -
 16
16 -
 17
17 -
 18
18 -
 19
19 -
 20
20 -
 21
21 -
22
-
23
-
24
-
25
-
26
-
27
-
28
-
29
-
30
-
31
-
32
-
33
-
34
-
35
-
36
-
37
-
38
-
39
-
40
-
41
-
42
-
43
-
44
-
45
-
46
-
47
-
48
-
49
-
50
-
51
-
52
-
53
-
54
-
55
-
56
-
57
-
58
-
59
-
60
-
61
-
62
-
63
-
64
-
65
-
66
-
67
-
68
-
69
-
70
-
71
-
72
-
73
-
74
-
75
-
76
-
77
-
78
-
79
-
80
-
81
-
82
-
83
-
84
-
85
-
86
-
87
-
88
-
89
-
90
-
91
-
92
-
93
-
94
-
95
-
96
-
97
-
98
-
99
-
100
-
101
-
102
-
103
-
104
-
105
-
106
-
107
-
108
-
109
-
110
-
111
-
112
-
113
-
114
-
115
-
116
-
117
-
118
-
119
-
120
-
121
-
122
-
123
-
124
-
125
-
126
-
127
-
128
-
129
-
130
-
131
-
132
-
133
-
134
-
135
-
136
-
137
-
138
-
139
-
140
-
141
-
142
-
143
-
144
-
145
-
146
-
147
-
148
-
149
-
150
-
151
-
152
-
153
-
154
-
155
-
156
-
157
-
158
 |
 |

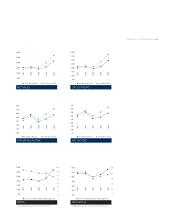
1,000
2,000
3,000
4,000
5,000
6,000
2001
2002
2003
2004
2005
in millions of US$in millions of Euro
2001
2002
2003
2004
2005
in millions of US$in millions of Euro
500
1,000
1,500
2,000
2,500
3,000
3,500
4,000
50
100
150
200
250
300
350
400
450
2001
2002
2003
2004
2005
in millions of US$in millions of Euro
100
200
300
400
500
600
700
800
2001
2002
2003
2004
2005
in millions of US$in millions of Euro
500
1,000
1,500
2,000
2,500
3,000
3,500
2%
4%
6%
8%
10%
12%
14%
16%
2001
2002
2003
2004
2005
margin in %sales (in millions of Euro) margin in %sales (in millions of Euro)
2001
2002
2003
2004
2005
200
400
600
800
1,000
1,200
1,400
5
%
10
%
15
%
20
%
25
%
30
%
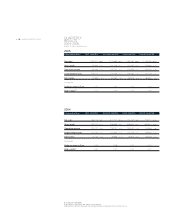
PROFILE OF LUXOTTICA GROUP |9<
NET SALES AND OPERATING MARGIN IN % GROSS SALES AND OPERATING MARGIN IN %
OPERATING INCOME NET INCOME
RETAIL WHOLESALE
NET SALES GROSS PROFIT