LensCrafters 2005 Annual Report Download - page 62
Download and view the complete annual report
Please find page 62 of the 2005 LensCrafters annual report below. You can navigate through the pages in the report by either clicking on the pages listed below, or by using the keyword search tool below to find specific information within the annual report.-
 1
1 -
2
-
3
-
4
-
5
-
6
-
7
-
8
-
9
-
10
-
11
-
12
-
13
-
14
-
15
-
16
-
17
-
18
-
19
-
20
-
21
-
22
-
23
-
24
-
25
-
26
-
27
-
28
-
29
-
30
-
31
-
32
-
33
-
34
-
35
-
36
-
37
-
38
-
39
-
40
-
41
-
42
-
43
-
44
-
45
-
46
-
47
-
48
-
49
-
50
-
51
-
 52
52 -
 53
53 -
 54
54 -
 55
55 -
 56
56 -
 57
57 -
 58
58 -
 59
59 -
 60
60 -
 61
61 -
 62
62 -
 63
63 -
 64
64 -
 65
65 -
 66
66 -
 67
67 -
 68
68 -
 69
69 -
 70
70 -
 71
71 -
 72
72 -
73
-
74
-
75
-
76
-
77
-
78
-
79
-
80
-
81
-
82
-
83
-
84
-
85
-
86
-
87
-
88
-
89
-
90
-
91
-
92
-
93
-
94
-
95
-
96
-
97
-
98
-
99
-
100
-
101
-
102
-
103
-
104
-
105
-
106
-
107
-
108
-
109
-
110
-
111
-
112
-
113
-
114
-
115
-
116
-
117
-
118
-
119
-
120
-
121
-
122
-
123
-
124
-
125
-
126
-
127
-
128
-
129
-
130
-
131
-
132
-
133
-
134
-
135
-
136
-
137
-
138
-
139
-
140
-
141
-
142
-
143
-
144
-
145
-
146
-
147
-
148
-
149
-
150
-
151
-
152
-
153
-
154
-
155
-
156
-
157
-
158
 |
 |

| 61 <
MANAGEMENT’S
DISCUSSION
AND ANALYSIS
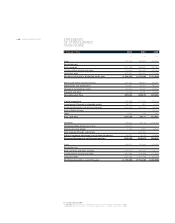
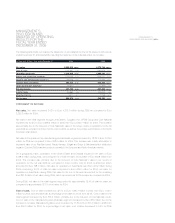
In accordance with U.S. GAAP
(1) 2003-2005 figures include results of OPSM Group operations from the acquisition date (August 1, 2003).
(2) 2004 and 2005 figures include results of Cole National operations from the acquisition date (October 4, 2004).
STATEMENTS OF
CONSOLIDATED INCOME
(for years ended December 31)
In thousands of Euro 2002 2003 2004 2005
(1) (1) (2) (1) (2)
Net sales 3,201,788 100.0% 2,852,194 100.0% 3,255,300 100.0% 4,370,744 100.0%
Cost of sales (946,134) 29.6% (903,617) 31.7% (1,040,697) 32.0% (1,380,653) 31.6%
Purchases and inventory variance (509,725) 15.9% (506,335) 17.8% (571,038) 17.5% (815,893) 18.7%
Manufacturing cost (147,977) 4.6% (134,037) 4.7% (190,041) 5.8% (234,581) 5.4%
Manufacturing depreciation (27,224) 0.9% (22,320) 0.8% (22,742) 0.7% (28,788) 0.7%
Manufacturing personnel cost (261,208) 8.2% (240,925) 8.4% (256,876) 7.9% (301,391) 6.9%
Gross profit 2,255,654 70.4% 1,948,577 68.3% 2,214,603 68.0% 2,990,091 68.4%
Operating expenses (1,654,146) 51.7% (1,516,790) 53.2% (1,721,789) 52.9% (2,387,537) 54.6%
Selling expenses (1,087,321) 34.0% (1,015,918) 35.6% (1,133,114) 34.8% (1,564,006) 35.8%
Royalties (62,274) 1.9% (41,537) 1.5% (51,002) 1.6% (67,050) 1.5%
Advertising expenses (210,744) 6.6% (178,303) 6.3% (192,430) 5.9% (278,691) 6.4%
General and administrative expenses (257,742) 8.0% (243,717) 8.5% (300,095) 9.2% (423,619) 9.7%
Goodwill and trademark amortization (36,065) 1.1% (37,316) 1.3% (45,148) 1.4% (54,170) 1.2%
Operating income 601,508 18.8% 431,787 15.1% 492,814 15.1% 602,554 13.8%
Other income/(expenses) (62,066) 1.9% (41,994) 1.5% (35,661) 1.1% (44,985) 1.0%
Financial income 5,036 0.2% 5,922 0.2% 6,662 0.2% 5,650 0.1%
Financial charges (65,935) 2.1% (47,117) 1.7% (56,115) 1.7% (66,332) 1.5%
Other income and charges (1,167) 0.0% (799) 0.0% 13,792 0.4% 15,697 0.4%
Income before taxes 539,442 16.8% 389,793 13.7% 457,153 14.0% 557,569 12.8%
Provision for income taxes (162,696) 5.1% (117,328) 4.1% (161,665) 5.0% (206,022) 4.7%
Minority interests (4,669) 0.1% (5,122) 0.2% (8,614) 0.3% (9,253) 0.2%
Net income 372,077 11.6% 267,343 9.4% 286,874 8.8% 342,294 7.8%