LensCrafters 2005 Annual Report Download - page 104
Download and view the complete annual report
Please find page 104 of the 2005 LensCrafters annual report below. You can navigate through the pages in the report by either clicking on the pages listed below, or by using the keyword search tool below to find specific information within the annual report.-
 1
1 -
2
-
3
-
4
-
5
-
6
-
7
-
8
-
9
-
10
-
11
-
12
-
13
-
14
-
15
-
16
-
17
-
18
-
19
-
20
-
21
-
22
-
23
-
24
-
25
-
26
-
27
-
28
-
29
-
30
-
31
-
32
-
33
-
34
-
35
-
36
-
37
-
38
-
39
-
40
-
41
-
42
-
43
-
44
-
45
-
46
-
47
-
48
-
49
-
50
-
51
-
52
-
53
-
54
-
55
-
56
-
57
-
58
-
59
-
60
-
61
-
62
-
63
-
64
-
65
-
66
-
67
-
68
-
69
-
70
-
71
-
72
-
73
-
74
-
75
-
76
-
77
-
78
-
79
-
80
-
81
-
82
-
83
-
84
-
85
-
86
-
87
-
88
-
89
-
90
-
91
-
92
-
93
-
 94
94 -
 95
95 -
 96
96 -
 97
97 -
 98
98 -
 99
99 -
 100
100 -
 101
101 -
 102
102 -
 103
103 -
 104
104 -
 105
105 -
 106
106 -
 107
107 -
 108
108 -
 109
109 -
 110
110 -
 111
111 -
 112
112 -
 113
113 -
 114
114 -
115
-
116
-
117
-
118
-
119
-
120
-
121
-
122
-
123
-
124
-
125
-
126
-
127
-
128
-
129
-
130
-
131
-
132
-
133
-
134
-
135
-
136
-
137
-
138
-
139
-
140
-
141
-
142
-
143
-
144
-
145
-
146
-
147
-
148
-
149
-
150
-
151
-
152
-
153
-
154
-
155
-
156
-
157
-
158
 |
 |

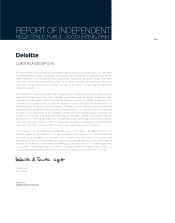
REPORT OF INDEPENDENT
PUBLIC ACCOUNTING FIRM | 103 <
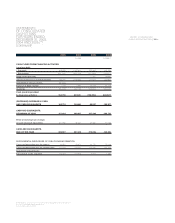
(1) Translated for convenience at the New York City Noon Buying Rate as determined in Note 1.
See notes to Consolidated Financial Statements.
(*) In accordance with U.S. GAAP.
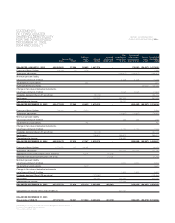
STATEMENTS
OF CONSOLIDATED
SHAREHOLDERS' EQUITY
FOR THE YEARS ENDED
DECEMBER 31, 2003,
2004 AND 2005 (*)
Other Accumulated
Additional Unearned comprehensive other compre- Treasury Consolidated
Common Stock paid-in Retained stock-based income (loss) hensive income shares, shareholders’
Shares Amount capital earnings compensation net of tax (loss) net of tax at cost equity
BALANCES, JANUARY 1, 2003 454,263,600 27,256 38,693 1,447,374 - (70,881) (24,547) 1,417,895
Exercise of Stock Options 213,433 13 1,476 1,489
Translation adjustment (169,307) (169,307) (169,307)
Minimum pension liability,
net of taxes of Euro 0.7 million (1,228) (1,228) (1,228)
Tax benefit on stock options 254 254
Purchase of treasury shares (45,440) (45,440)
Change in fair value of derivative instruments,
net of taxes of Euro 0.4 million (1,067) (1,067) (1,067)
Dividends declared (Euro 0.21 per share) (95,405) (95,405)
Net income 267,343 267,343 267,343
Comprehensive income 95,741
BALANCES DECEMBER 31, 2003 454,477,033 27,269 40,423 1,619,312 - (242,483) (69,987) 1,374,534
Exercise of Stock Options 728,440 43 5,950 5,993
Translation adjustment (79,897) (79,897) (79,897)
Minimum pension liability,
net of taxes of Euro 0.2 million 248 248 248
Tax benefit on stock options 794 794
Change in fair value of derivative instruments,
net of taxes of Euro 0.2 million 1,174 1,174 1,174
Dividends declared (Euro 0.21 per share) (94,113) (94,113)
Net income 286,874 286,874 286,874
Comprehensive income 208,399
BALANCES DECEMBER 31, 2004 455,205,473 27,312 47,167 1,812,073 - (320,958) (69,987) 1,495,607
Exercise of Stock Options 2,770,250 167 28,062 28,229
Translation adjustment 157,776 157,776 157,776
Aggregate stock based compensation, net of tax 70,273 (70,273) -
Realized stock based compensation, net of tax 21,706 21,706
Minimum pension liability,
net of taxes of Euro 1.6 million 2,534 2,534 2,534
Tax benefit on stock options 4,677 4,677
Change in fair value of derivative instruments,
net of taxes of Euro 2.3 million 4,694 4,694 4,694
Dividends declared (Euro 0.23 per share) (103,484) (103,484)
Net income 342,294 342,294 342,294
Comprehensive income 507,298
BALANCES DECEMBER 31, 2005 457,975,723 27,479 150,179 2,050,883 (48,567) (155,954) (69,987) 1,954,033
Comprehensive income (thousands of US$) (1) 600,742
BALANCES DECEMBER 31, 2005
(thousands of US$) (1) 457,975,723 32,541 177,842 2,428,656 (57,513) (184,681) (82,879) 2,313,966