LensCrafters 2005 Annual Report Download - page 63
Download and view the complete annual report
Please find page 63 of the 2005 LensCrafters annual report below. You can navigate through the pages in the report by either clicking on the pages listed below, or by using the keyword search tool below to find specific information within the annual report.-
 1
1 -
2
-
3
-
4
-
5
-
6
-
7
-
8
-
9
-
10
-
11
-
12
-
13
-
14
-
15
-
16
-
17
-
18
-
19
-
20
-
21
-
22
-
23
-
24
-
25
-
26
-
27
-
28
-
29
-
30
-
31
-
32
-
33
-
34
-
35
-
36
-
37
-
38
-
39
-
40
-
41
-
42
-
43
-
44
-
45
-
46
-
47
-
48
-
49
-
50
-
51
-
52
-
 53
53 -
 54
54 -
 55
55 -
 56
56 -
 57
57 -
 58
58 -
 59
59 -
 60
60 -
 61
61 -
 62
62 -
 63
63 -
 64
64 -
 65
65 -
 66
66 -
 67
67 -
 68
68 -
 69
69 -
 70
70 -
 71
71 -
 72
72 -
 73
73 -
74
-
75
-
76
-
77
-
78
-
79
-
80
-
81
-
82
-
83
-
84
-
85
-
86
-
87
-
88
-
89
-
90
-
91
-
92
-
93
-
94
-
95
-
96
-
97
-
98
-
99
-
100
-
101
-
102
-
103
-
104
-
105
-
106
-
107
-
108
-
109
-
110
-
111
-
112
-
113
-
114
-
115
-
116
-
117
-
118
-
119
-
120
-
121
-
122
-
123
-
124
-
125
-
126
-
127
-
128
-
129
-
130
-
131
-
132
-
133
-
134
-
135
-
136
-
137
-
138
-
139
-
140
-
141
-
142
-
143
-
144
-
145
-
146
-
147
-
148
-
149
-
150
-
151
-
152
-
153
-
154
-
155
-
156
-
157
-
158
 |
 |

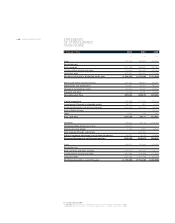
> 62 | ANNUAL REPORT 2005
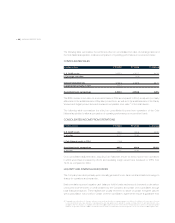
In accordance with U.S.GAAP
(1) 2003-2005 figures include results of OPSM Group operations from the acquisition date (August 1, 2003).
(2) 2004-2005 figures include results of Cole National operations from the acquisition date (October 4, 2004).
STATEMENTS
OF CONSOLIDATED
CASH FLOWS
In thousands of Euro 2003 2004 2005
(1) (1) (2) (1) (2)
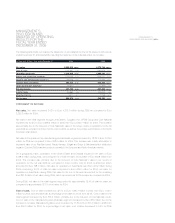
Cash 151,418 299,973 257,349
Restricted cash ---
Bank overdraft (371,729) (516,905) (290,531)
Current portion of long-term debt (178,335) (390,935) (405,369)
Long-term debt (855,654) (862,492) (1,277,495)
Net financial position, beginning of the year (1,254,300) (1,470,395) (1,716,046)
Net income before minority interests 267,343 286,874 342,294
Depreciation and amortization 134,840 152,751 194,205
Change in net working capital (94,910) 34,061 134,846
Provision and other 20,266 54,992 (47,885)
Operating cash flow 327,539 528,678 623,460
Capital expenditure (81,288) (117,420) (229,416)
(Investments)/Disposal in intangible assets (48,177) (301) (4,479)
Purchase of business net of cash acquired (342,432) (362,978) (86,966)
Sale of Pearle Europe - - 144,000
Other 3,839 198 1,082
Free cash flow (141,020) 48,177 447,681
Dividends (95,405) (94,113) (103,484)
(Purchases)/Sale of treasury shares (45,440) - -
Exercise of stock options 1,476 5,994 28,229
Debt acquired through acquisitions - (275,952) -
Effect of exchange adjustments to net financial position 64,294 70,243 (91,618)
Decrease/(Increase) in net financial position (216,095) (245,651) 280,808
Cash 299,973 257,349 372,256
Restricted cash ---
Bank overdraft and notes payable (516,905) (290,531) (276,122)
Current portion of long-term debt (390,935) (405,369) (111,323)
Long-term debt (862,492) (1,277,495) (1,420,049)
Net financial position, end of the year (1,470,395) (1,716,046) (1,435,238)