LensCrafters 2005 Annual Report Download - page 106
Download and view the complete annual report
Please find page 106 of the 2005 LensCrafters annual report below. You can navigate through the pages in the report by either clicking on the pages listed below, or by using the keyword search tool below to find specific information within the annual report.-
 1
1 -
2
-
3
-
4
-
5
-
6
-
7
-
8
-
9
-
10
-
11
-
12
-
13
-
14
-
15
-
16
-
17
-
18
-
19
-
20
-
21
-
22
-
23
-
24
-
25
-
26
-
27
-
28
-
29
-
30
-
31
-
32
-
33
-
34
-
35
-
36
-
37
-
38
-
39
-
40
-
41
-
42
-
43
-
44
-
45
-
46
-
47
-
48
-
49
-
50
-
51
-
52
-
53
-
54
-
55
-
56
-
57
-
58
-
59
-
60
-
61
-
62
-
63
-
64
-
65
-
66
-
67
-
68
-
69
-
70
-
71
-
72
-
73
-
74
-
75
-
76
-
77
-
78
-
79
-
80
-
81
-
82
-
83
-
84
-
85
-
86
-
87
-
88
-
89
-
90
-
91
-
92
-
93
-
94
-
95
-
 96
96 -
 97
97 -
 98
98 -
 99
99 -
 100
100 -
 101
101 -
 102
102 -
 103
103 -
 104
104 -
 105
105 -
 106
106 -
 107
107 -
 108
108 -
 109
109 -
 110
110 -
 111
111 -
 112
112 -
 113
113 -
 114
114 -
 115
115 -
 116
116 -
117
-
118
-
119
-
120
-
121
-
122
-
123
-
124
-
125
-
126
-
127
-
128
-
129
-
130
-
131
-
132
-
133
-
134
-
135
-
136
-
137
-
138
-
139
-
140
-
141
-
142
-
143
-
144
-
145
-
146
-
147
-
148
-
149
-
150
-
151
-
152
-
153
-
154
-
155
-
156
-
157
-
158
 |
 |

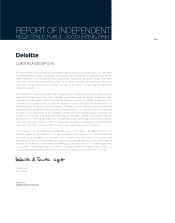
REPORT OF INDEPENDENT
PUBLIC ACCOUNTING FIRM | 105 <
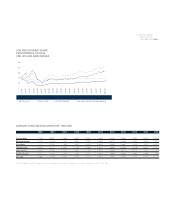
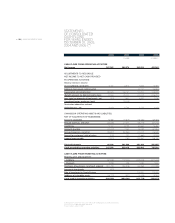
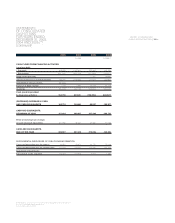
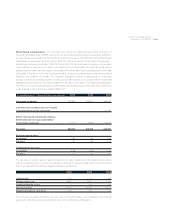
2003 2004 2005 2005
(Euro/000) (US$/000) (1)
CASH FLOWS FROM FINANCING ACTIVITIES
Long-term debt:
• Proceeds 619,859 1,187,601 373,462 442,254
• Repayments (332,045) (935,443) (627,949) (743,617)
Swap termination fees - - (7,062) (8,363)
(Decrease) increase in overdraft balances 156,290 (246,680) (21,520) (25,484)
Investment in treasury shares (45,440) - - -
Exercise of Stock Options 1,476 5,994 28,229 33,429
Dividends (95,405) (94,113) (103,484) (122,546)
Cash (used in) provided
by financing activities 304,735 (82,641) (358,324) (424,327)
(DECREASE) INCREASE IN CASH
AND CASH EQUIVALENTS 163,715 (34,466) 89,357 105,817
CASH AND EQUIVALENTS,
BEGINNING OF YEAR 151,418 299,937 257,349 304,753
Effect of exchange rate changes
on cash and cash equivalents (15,196) (8,122) 25,550 30,256
CASH AND EQUIVALENTS,
END OF THE YEAR 299,937 257,349 372,256 440,826
SUPPLEMENTAL DISCLOSURE OF CASH FLOWS INFORMATION
Cash paid during the year for interest 44,951 58,371 61,770 73,148
Cash paid during the year for income taxes 110,609 108,440 153,287 181,522
Acquisition of businesses:
Fair value of assets acquired 102,323 157,905 3,702 4,384
STATEMENTS
OF CONSOLIDATED
CASH FLOWS
FOR YEARS ENDED
DECEMBER 31, 2003,
2004 AND 2005 (*)
(continued)
(1) Translated for convenience at the New York City Noon Buying Rate as determined in Note 1.
See notes to Consolidated Financial Statements.
(*) In accordance with U.S. GAAP.