LensCrafters 2005 Annual Report Download - page 12
Download and view the complete annual report
Please find page 12 of the 2005 LensCrafters annual report below. You can navigate through the pages in the report by either clicking on the pages listed below, or by using the keyword search tool below to find specific information within the annual report.-
 1
1 -
 2
2 -
 3
3 -
 4
4 -
 5
5 -
 6
6 -
 7
7 -
 8
8 -
 9
9 -
 10
10 -
 11
11 -
 12
12 -
 13
13 -
 14
14 -
 15
15 -
 16
16 -
 17
17 -
 18
18 -
 19
19 -
 20
20 -
 21
21 -
 22
22 -
23
-
24
-
25
-
26
-
27
-
28
-
29
-
30
-
31
-
32
-
33
-
34
-
35
-
36
-
37
-
38
-
39
-
40
-
41
-
42
-
43
-
44
-
45
-
46
-
47
-
48
-
49
-
50
-
51
-
52
-
53
-
54
-
55
-
56
-
57
-
58
-
59
-
60
-
61
-
62
-
63
-
64
-
65
-
66
-
67
-
68
-
69
-
70
-
71
-
72
-
73
-
74
-
75
-
76
-
77
-
78
-
79
-
80
-
81
-
82
-
83
-
84
-
85
-
86
-
87
-
88
-
89
-
90
-
91
-
92
-
93
-
94
-
95
-
96
-
97
-
98
-
99
-
100
-
101
-
102
-
103
-
104
-
105
-
106
-
107
-
108
-
109
-
110
-
111
-
112
-
113
-
114
-
115
-
116
-
117
-
118
-
119
-
120
-
121
-
122
-
123
-
124
-
125
-
126
-
127
-
128
-
129
-
130
-
131
-
132
-
133
-
134
-
135
-
136
-
137
-
138
-
139
-
140
-
141
-
142
-
143
-
144
-
145
-
146
-
147
-
148
-
149
-
150
-
151
-
152
-
153
-
154
-
155
-
156
-
157
-
158
 |
 |

PROFILE OF LUXOTTICA GROUP |11<
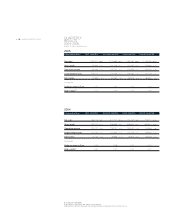
In accordance to U.S GAAP
(1) 1 ADS = 1 ordinary share.
(2) Proposed by the Board of Directors and to be submitted for approval at the Annual Shareholders’ Meeting on June 14, 2006.
(3) Figures include results of Sunglass Hut operations from the acquisition date (March 31, 2001).
(4) Figures include results of OPSM Group operations from the acquisition date (August 1, 2003).
(5) Figures include results of Cole National operations from the acquisition date (October 4, 2004).
(*) In Euro and US$.
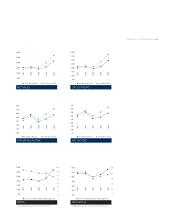
FINANCIAL
HIGHLIGHTS
2001-2005
In thousands of Euro 2001 2002 2003 2004 2005
In thousands of US$ (3) (3) (3) (4) (3) (4) (5) (3) (4) (5)
Net sales 3,105,498 100.0% 3,201,788 100.0% 2,852,194 100.0% 3,255,300 100.0% 4,370,744 100.0%
2,781,594 3,025,690 3,224,976 4,047,966 5,438,875
Gross profit 2,181,960 70.3% 2,255,654 70.4% 1,948,577 68.3% 2,214,603 68.0% 2,990,091 68.4%
1,954,382 2,131,593 2,203,256 2,753,859 3,720,815
Operating income 509,492 16.4% 601,508 18.8% 431,787 15.1% 492,814 15.1% 602,554 13.8%
456,352 568,425 488,222 612,814 749,807
Income before taxes 441,311 14.2% 539,442 16.8% 389,793 13.7% 457,153 14.0% 557,569 12.8%
395,282 509,772 440,739 568,470 693,829
Net income 316,373 10.2% 372,077 11.6% 267,343 9.4% 286,874 8.8% 342,294 7.8%
283,375 351,613 302,285 356,728 425,945
Per ordinary share (ADS) (1) (*)
Earnings 0.70 0.82 0.60 0.64 0.76
0.63 0.78 0.67 0.80 0.95
Dividend (2) 0.170 0.210 0.210 0.230 0.290
0.165 0.242 0.256 0.277 n.a.
Average number of outstanding shares 451,036,978 453,174,041 448,664,413 448,275,028 450,179,073