LensCrafters 2005 Annual Report Download - page 144
Download and view the complete annual report
Please find page 144 of the 2005 LensCrafters annual report below. You can navigate through the pages in the report by either clicking on the pages listed below, or by using the keyword search tool below to find specific information within the annual report.
NOTES TO CONSOLIDATED
FINANCIAL STATEMENTS | 143 <
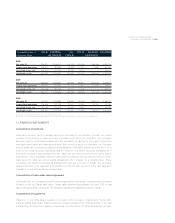
Year ended December 31 Italy (6) United States Asia- Other (6) Adjustments Consolidated
In thousands of Euro and Canada (6) Pacific (6) and eliminations
2005
Net sales (5) 998,420 3,048,341 516,793 575,196 (768,006) 4,370,744
Income from operations 258,391 323,625 46,993 51,200 (77,655) 602,554
Long lived assets, net 228,841 405,725 92,335 8,214 - 735,115
Identifiable assets 1,294,955 3,103,932 662,926 270,169 (358,460) 4,973,522
2004
Net sales (5) 832,813 2,083,560 464,905 486,630 (612,608) 3,255,300
Income from operations 189,944 257,897 40,717 44,690 (40,434) 492,814
Long lived assets, net 196,088 326,956 67,973 8,228 - 599,245
Identifiable assets 1,086,274 2,736,868 549,096 239,965 (56,145) 4,556,058
2003
Net sales (5) 743,327 1,949,692 276,626 445,459 (562,910) 2,852,194
Income from operations 106,808 222,733 20,541 41,555 40,150 431,787
Long lived assets, net 195,198 228,409 64,885 8,943 - 497,435
Identifiable assets 1,095,350 2,075,904 572,691 217,458 (48,727) 3,912,676
(5) No single customer represents 5% or more of sales in any year presented.
(6) Sales, income from operations and identifiable assets are the result of combination of legal entities located in the same geographic area.
13. FINANCIAL INSTRUMENTS
Concentration of credit risk
Financial instruments which potentially expose the Company to concentration of credit risk consist
primarily of investments in cash and cash equivalents and accounts receivable. The Company
attempts to limit its credit risk associated with cash equivalents by placing the Company’s investments
with highly rated banks and financial institutions. With respect to accounts receivable, the Company
limits its credit risk by performing ongoing credit evaluations. No single customer accounted for 10% or
more of the overall accounts receivable balance. However, included in accounts receivable as of
December 31, 2005 is approximately Euro 15.1 million due from the host stores of our license brands
retail division. These receivables represent cash sales deposited by the Company into the host stores’
bank accounts, which are subsequently forwarded to the Company on a monthly basis. These
receivables are based on contractual arrangements and are short-term in length. The Company
believes that there is no significant concentration of credit risk with respect to these cash and cash
equivalents investments and accounts receivable.
Concentration of sales under license agreement
In February 2004, the Company renewed its license agreement for the design, production and distribution
of frames under the Chanel trade name. Chanel sales represent approximately 4.4% and 3.8% of total
sales in 2004 and 2005, respectively. The renewed Chanel license agreement expires in 2008.
Concentration of supplier risk
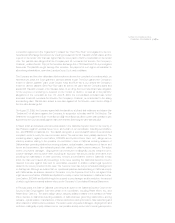
Oakley Inc. is one of the largest suppliers of products to the Company’s retail division. For the 2003,
2004 and 2005 fiscal years, Oakley accounted for approximately 8.7%, 6.8% and 4.9% of the total
merchandise purchases from suppliers, respectively. As of December 31, 2005, the previous purchase


