LensCrafters 2005 Annual Report Download - page 135
Download and view the complete annual report
Please find page 135 of the 2005 LensCrafters annual report below. You can navigate through the pages in the report by either clicking on the pages listed below, or by using the keyword search tool below to find specific information within the annual report.-
 1
1 -
2
-
3
-
4
-
5
-
6
-
7
-
8
-
9
-
10
-
11
-
12
-
13
-
14
-
15
-
16
-
17
-
18
-
19
-
20
-
21
-
22
-
23
-
24
-
25
-
26
-
27
-
28
-
29
-
30
-
31
-
32
-
33
-
34
-
35
-
36
-
37
-
38
-
39
-
40
-
41
-
42
-
43
-
44
-
45
-
46
-
47
-
48
-
49
-
50
-
51
-
52
-
53
-
54
-
55
-
56
-
57
-
58
-
59
-
60
-
61
-
62
-
63
-
64
-
65
-
66
-
67
-
68
-
69
-
70
-
71
-
72
-
73
-
74
-
75
-
76
-
77
-
78
-
79
-
80
-
81
-
82
-
83
-
84
-
85
-
86
-
87
-
88
-
89
-
90
-
91
-
92
-
93
-
94
-
95
-
96
-
97
-
98
-
99
-
100
-
101
-
102
-
103
-
104
-
105
-
106
-
107
-
108
-
109
-
110
-
111
-
112
-
113
-
114
-
115
-
116
-
117
-
118
-
119
-
120
-
121
-
122
-
123
-
124
-
 125
125 -
 126
126 -
 127
127 -
 128
128 -
 129
129 -
 130
130 -
 131
131 -
 132
132 -
 133
133 -
 134
134 -
 135
135 -
 136
136 -
 137
137 -
 138
138 -
 139
139 -
 140
140 -
 141
141 -
 142
142 -
 143
143 -
 144
144 -
 145
145 -
146
-
147
-
148
-
149
-
150
-
151
-
152
-
153
-
154
-
155
-
156
-
157
-
158
 |
 |

> 134 | ANNUAL REPORT 2005
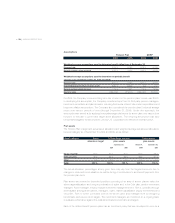
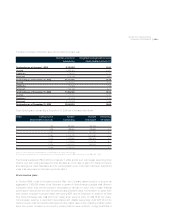
Assumptions
Pension Plan SERP
2004 2005 2004 2005
Weighted-average assumptions used to determine benefit obligations at September 30
Discount rate 5.75 % 5.75% 5.75 % 5.75%
Rate of compensation increase 4.25 % 4.25% 4.25 % 4.25%
Weighted-average assumptions used to determine net periodic benefit
cost for years ended December 31, 2004 and 2005:
Discount rate 6.00 % 5.75% 6.00 % 5.75%
Expected long-term return on plan assets 8.50 % 8.50% n.a. n.a.
Rate of compensation increase 4.75 % 4.25% 4.75 % 4.25%
Mortality table 1983 GAM RP-2000 1983 GAM RP-2000
For 2005, the Company’s assumed long-term rate of return on the pension plans’ assets was 8.50%.
In developing this assumption, the Company considered input from its third-party pension managers,
investment consultants and plan actuaries, including their review of asset class return expectations and
long-term inflation assumptions. The Company also considered the pension plans’ historical average
return over various periods of time (through December 31, 2004). Under this approach, the
assumption was arrived at by applying historical average total returns by asset class over various time
horizons to the plan’s current and target asset allocations. The resulting assumption was also
benchmarked against the assumptions used by U.S. corporations as reflected in several surveys.
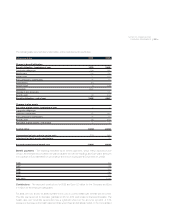
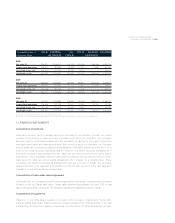
Plan assets
The Pension Plan’s target and actual asset allocations and weighted average actual asset allocations
by asset category as of September 30, 2004 and 2005, are as follows:
Asset category Asset US Holdings pension Cole pension
allocation target plan assets plan assets
September 30, October 4, September 30,
2004 2005 2004 2005
Equity securities 65 % 62 % 60 % 65 % 68 %
Debt securities 35 % 35 % 36 % 33 % 31 %
Other 0 % 3 % 4 % 2 % 1 %
Total 100 % 100 % 100 % 100 % 100 %
The actual allocation percentages at any given time may vary from the targeted amounts due to
changes in stock and bond valuations as well as timing of contributions to and benefit payments from
the pension plan trusts.
Plan assets are invested in diversified portfolios consisting of an array of assets classes within the
above target allocations and using a combination of active and, in the Cole plan, passive investment
strategies. Active strategies employ multiple investment management firms. Risk is controlled through
diversification among asset classes, managers, styles, market capitalization (equity investments) and
securities. Risk is further controlled both at the asset class and manager level by assigning
benchmarks and excess return targets. The investment managers are monitored on a ongoing basis
to evaluate performance against the established market benchmarks and targets.
Each of the defined benefit pension plans has an investment policy that was developed to serve as a