LensCrafters 2005 Annual Report Download - page 143
Download and view the complete annual report
Please find page 143 of the 2005 LensCrafters annual report below. You can navigate through the pages in the report by either clicking on the pages listed below, or by using the keyword search tool below to find specific information within the annual report.-
 1
1 -
2
-
3
-
4
-
5
-
6
-
7
-
8
-
9
-
10
-
11
-
12
-
13
-
14
-
15
-
16
-
17
-
18
-
19
-
20
-
21
-
22
-
23
-
24
-
25
-
26
-
27
-
28
-
29
-
30
-
31
-
32
-
33
-
34
-
35
-
36
-
37
-
38
-
39
-
40
-
41
-
42
-
43
-
44
-
45
-
46
-
47
-
48
-
49
-
50
-
51
-
52
-
53
-
54
-
55
-
56
-
57
-
58
-
59
-
60
-
61
-
62
-
63
-
64
-
65
-
66
-
67
-
68
-
69
-
70
-
71
-
72
-
73
-
74
-
75
-
76
-
77
-
78
-
79
-
80
-
81
-
82
-
83
-
84
-
85
-
86
-
87
-
88
-
89
-
90
-
91
-
92
-
93
-
94
-
95
-
96
-
97
-
98
-
99
-
100
-
101
-
102
-
103
-
104
-
105
-
106
-
107
-
108
-
109
-
110
-
111
-
112
-
113
-
114
-
115
-
116
-
117
-
118
-
119
-
120
-
121
-
122
-
123
-
124
-
125
-
126
-
127
-
128
-
129
-
130
-
131
-
132
-
 133
133 -
 134
134 -
 135
135 -
 136
136 -
 137
137 -
 138
138 -
 139
139 -
 140
140 -
 141
141 -
 142
142 -
 143
143 -
 144
144 -
 145
145 -
 146
146 -
 147
147 -
 148
148 -
 149
149 -
 150
150 -
 151
151 -
 152
152 -
 153
153 -
154
-
155
-
156
-
157
-
158
 |
 |

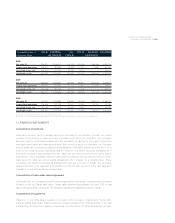
> 142 | ANNUAL REPORT 2005
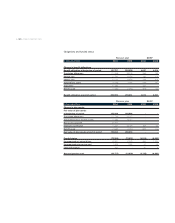
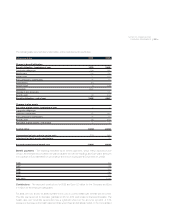
Year ended December 31, Manufacturing Retail Inter-segment Consolidated
and wholesale transactions and
In thousands of Euro corporate adjustments
2005
Net sales 1,310,273 3,298,171 (237,700) (1) 4,370,744
Income from operations 304,333 378,425 (80,204) (2) 602,554
Capital expenditures 81,070 148,346 - 229,416
Depreciation and amortization 48,720 111,115 34,370
(3) 194,205
Identifiable assets 1,590,091 1,388,189 1,995,242
(4) 4,973,522
2004
Net sales 1,094,802 2,346,683 (186,185) (1) 3,255,300
Income from operations 233,129 310,340 (50,655) (2) 492,814
Capital expenditures 31,367 86,053 - 117,420
Depreciation and amortization 47,656 79,563 25,532
(3) 152,751
Identifiable assets 1,566,086 1,211,781 1,778,191
(4) 4,556,058
2003
Net sales 996,694 2,028,237 (172,737) (1) 2,852,194
Income from operations 191,116 269,851 (29,180) (2) 431,787
Capital expenditures 23,580 57,708 - 81,288
Depreciation and amortization 45,208 68,606 21,026
(3) 134,840
Identifiable assets 1,528,074 876,661 1,507,941
(4) 3,912,676
(1) Inter-segment elimination of net revenues relates to intercompany sales from the manufacturing and wholesale segment to the retail segment.
(2) Inter-segment elimination of operating income mainly relates to depreciation and amortization of corporate identifiable assets and profit-in-stock elimination for
frames manufactured by the wholesale business and included in the retail segment inventory.
(3) Inter-segment elimination of depreciation and amortization relates to depreciation and amortization of corporate identifiable assets.
(4) Inter-segment elimination of identifiable assets includes mainly the net value of goodwill and trade names of acquired retail businesses.
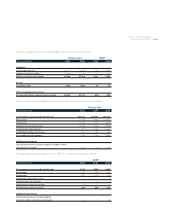
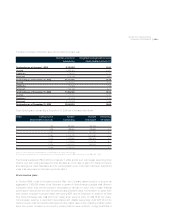
The geographic segments include Italy, the main manufacturing and distribution base, United States
and Canada (which includes the United States of America, Canada and Caribbean islands), Asia-
Pacific (which includes Australia, New Zealand, Singapore, Malaysia, Thailand, China, Hong Kong,
Japan and Taiwan) and Other (which includes all other geographic locations including Europe
(excluding Italy), South and Central America and the Middle East). Sales are attributed to geographic
segments based on the legal entity domicile where the sale is originated. Intercompany sales included
in inter-segment elimination are accounted for on a cost plus mark-up basis.