Kroger 2011 Annual Report Download - page 93
Download and view the complete annual report
Please find page 93 of the 2011 Kroger annual report below. You can navigate through the pages in the report by either clicking on the pages listed below, or by using the keyword search tool below to find specific information within the annual report.-
 1
1 -
2
-
3
-
4
-
5
-
6
-
7
-
8
-
9
-
10
-
11
-
12
-
13
-
14
-
15
-
16
-
17
-
18
-
19
-
20
-
21
-
22
-
23
-
24
-
25
-
26
-
27
-
28
-
29
-
30
-
31
-
32
-
33
-
34
-
35
-
36
-
37
-
38
-
39
-
40
-
41
-
42
-
43
-
44
-
45
-
46
-
47
-
48
-
49
-
50
-
51
-
52
-
53
-
54
-
55
-
56
-
57
-
58
-
59
-
60
-
61
-
62
-
63
-
64
-
65
-
66
-
67
-
68
-
69
-
70
-
71
-
72
-
73
-
74
-
75
-
76
-
77
-
78
-
79
-
80
-
81
-
82
-
 83
83 -
 84
84 -
 85
85 -
 86
86 -
 87
87 -
 88
88 -
 89
89 -
 90
90 -
 91
91 -
 92
92 -
 93
93 -
 94
94 -
 95
95 -
 96
96 -
 97
97 -
 98
98 -
 99
99 -
 100
100 -
 101
101 -
 102
102 -
 103
103 -
104
-
105
-
106
-
107
-
108
-
109
-
110
-
111
-
112
-
113
-
114
-
115
-
116
-
117
-
118
-
119
-
120
-
121
-
122
-
123
-
124
 |
 |

A-38
NO T E S T O CO N S O L I D A T E D FI N A N C I A L ST A T E M E N T S , CO N T I N U E D
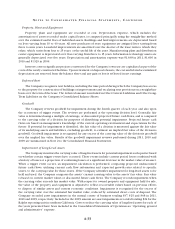
types of customers, and are allocated capital from a centralized location. The Company’s operating divisions
reflect the manner in which the business is managed and how the Company’s Chief Executive Officer and
Chief Operating Officer, who act as the Company’s Chief Operating Decision Makers, assess performance
internally. All of the Company’s operations are domestic.
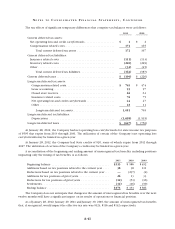
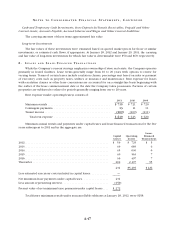
The following table presents sales revenue by type of product for 2011, 2010 and 2009.
2011 2010 2009
Amount % of total Amount % of total Amount % of total
Non Perishable (1) ............ $46,494 51.4% $44,615 54.4% $43,320 56.5%
Perishable (2) . . . . . . . . . . . . . . . 18,693 20.7% 17,532 21.4% 16,544 21.6%
Fuel ....................... 16,901 18.7% 12,081 14.7% 8,943 11.7%
Pharmacy .................. 7,322 8.1% 6,929 8.4% 6,885 9.0%
Other (3) ................... 964 1.1% 892 1.1% 917 1.2%
Total Sales and other revenue ... $90,374 100.0% $82,049 100.0% $76,609 100.0%
(1) Consists primarily of grocery, general merchandise, health and beauty care and natural foods.
(2) Consists primarily of produce, floral, meat, seafood, deli and bakery.
(3) Consists primarily of jewelry store sales, outside manufacturing sales and sales from entities not controlled
by the Company.
2. GO O D W I L L
The following table summarizes the changes in the Company’s net goodwill balance through January 28,
2012.
2011 2010
Balance beginning of the year
Goodwill ................................................ $ 3,672 $ 3,672
Accumulated impairment losses . . . . . . . . . . . . . . . . . . . . . . . . . . . . . . (2,532) (2,514)
1,140 1,158
Activity during the year
Goodwill impairment charge ................................. —(18)
Disposition ............................................... (2) —
Balance end of year
Goodwill ................................................ 3,672 3,672
Accumulated impairment losses . . . . . . . . . . . . . . . . . . . . . . . . . . . . . . (2,532) (2,532)
Disposition ............................................... (2) —
$ 1,138 $ 1,140
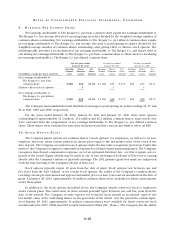
Testing for impairment must be performed annually, or on an interim basis upon the occurrence of
a triggering event or a change in circumstances that would more likely than not reduce the fair value of a
reporting unit below its carrying amount. The annual evaluation of goodwill performed during the fourth
quarter of 2011 and 2009 did not result in impairment.
The annual evaluation of goodwill performed during the fourth quarter of 2010 resulted in an
impairment charge of $18. Based on the results of the Company’s step one analysis in the fourth quarter of
2010, a supermarket reporting unit with a small number of stores indicated potential impairment. Due to
estimated future expected cash flows being lower than in the past, the estimated fair value of the reporting
unit decreased. Management concluded that the carrying value of goodwill for this reporting unit exceeded