Kroger 2011 Annual Report Download - page 36
Download and view the complete annual report
Please find page 36 of the 2011 Kroger annual report below. You can navigate through the pages in the report by either clicking on the pages listed below, or by using the keyword search tool below to find specific information within the annual report.-
 1
1 -
2
-
3
-
4
-
5
-
6
-
7
-
8
-
9
-
10
-
11
-
12
-
13
-
14
-
15
-
16
-
17
-
18
-
19
-
20
-
21
-
22
-
23
-
24
-
25
-
 26
26 -
 27
27 -
 28
28 -
 29
29 -
 30
30 -
 31
31 -
 32
32 -
 33
33 -
 34
34 -
 35
35 -
 36
36 -
 37
37 -
 38
38 -
 39
39 -
 40
40 -
 41
41 -
 42
42 -
 43
43 -
 44
44 -
 45
45 -
 46
46 -
47
-
48
-
49
-
50
-
51
-
52
-
53
-
54
-
55
-
56
-
57
-
58
-
59
-
60
-
61
-
62
-
63
-
64
-
65
-
66
-
67
-
68
-
69
-
70
-
71
-
72
-
73
-
74
-
75
-
76
-
77
-
78
-
79
-
80
-
81
-
82
-
83
-
84
-
85
-
86
-
87
-
88
-
89
-
90
-
91
-
92
-
93
-
94
-
95
-
96
-
97
-
98
-
99
-
100
-
101
-
102
-
103
-
104
-
105
-
106
-
107
-
108
-
109
-
110
-
111
-
112
-
113
-
114
-
115
-
116
-
117
-
118
-
119
-
120
-
121
-
122
-
123
-
124
 |
 |

34
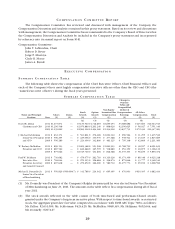
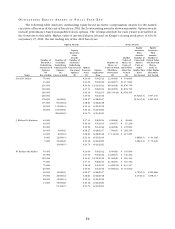
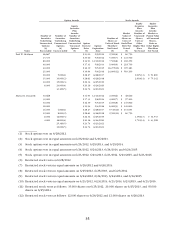
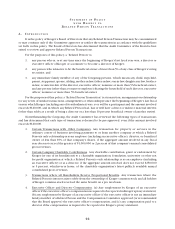
OU T S T A N D I N G EQ U I T Y AW A R D S A T FI S C A L YE A R -EN D
The following table discloses outstanding equity-based incentive compensation awards for the named
executive officers as of the end of fiscal year 2011. Each outstanding award is shown separately. Option awards
include performance-based nonqualified stock options. The vesting schedule for each award is described in
the footnotes to this table. Market value of unvested shares is based on Kroger’s closing stock price of $24.30
on January 27, 2012, the last trading day of the 2011 fiscal year.
Option Awards Stock Awards
Name
Number of
Securities
Underlying
Unexercised
Options
(#)
Exercisable
Number of
Securities
Underlying
Unexercised
Options
(#)
Unexercisable
Equity
Incentive
Plan
Awards:
Number of
Securities
Underlying
Unexercised
Unearned
Options
(#)
Option
Exercise
Price
($)
Option
Expiration
Date
Number of
Shares or
Units of Stock
That Have
Not Vested
(#)
Market
Value of
Shares or
Units of
Stock That
Have Not
Vested
($)
Equity
Incentive
Plan
Awards:
Number of
Unearned
Shares,
Units or
Other
Rights That
Have
Not Vested
Equity
Incentive
Plan
Awards:
Market or
Payout Value
of Unearned
Shares,
Units or
Other Rights
That Have
Not Vested
David B. Dillon 70,000 $23.00 5/9/2012 22,000(6) $ 534,600
35,000 $23.00 5/9/2012 46,000(7) $1,117,800
210,000 $14.93 12/12/2012 69,000(8) $1,676,700
300,000 $17.31 5/6/2014 69,000(9) $1,676,700
300,000 $16.39 5/5/2015 106,350(10) $2,584,305
240,000 $19.94 5/4/2016 15,525(13) $397,130
176,000 44,000(1) $28.27 6/28/2017 19,143(14) $491,018
135,000 90,000(2) $28.61 6/26/2018
90,000 135,000(3) $22.34 6/25/2019
46,000 184,000(4) $20.16 6/24/2020
283,600(5) $24.74 6/23/2021
J. Michael Schlotman 40,000 $17.31 5/6/2014 2,000(6) $ 48,600
40,000 $16.39 5/5/2015 4,000(7) $ 97,200
20,000 $19.94 5/4/2016 6,000(8) $ 145,800
16,000 4,000(1) $28.27 6/28/2017 7,500(9) $ 182,250
12,000 8,000(2) $28.61 6/26/2018 17,115(10) $ 415,895
8,000 12,000(3) $22.34 6/25/2019 1,688(13) $ 43,166
5,000 20,000(4) $20.16 6/24/2020 3,081(14) $ 79,020
45,640(5) $24.74 6/23/2021
W. Rodney McMullen 50,000 $23.00 5/9/2012 6,000(6) $ 145,800
25,000 $23.00 5/9/2012 14,000(7) $ 340,200
150,000 $14.93 12/12/2012 21,000(8) $ 510,300
75,000 $17.31 5/6/2014 21,000(9) $ 510,300
75,000 $16.39 5/5/2015 34,290(10) $ 833,247
60,000 $19.94 5/4/2016 70,000(11) $1,701,000
48,000 12,000(1) $28.27 6/28/2017 4,725(13) $120,866
39,000 26,000(2) $28.61 6/26/2018 6,172(14) $158,317
26,000 39,000(3) $22.34 6/25/2019
14,000 56,000(4) $20.16 6/24/2020
91,440(5) $24.74 6/23/2021