Kroger 2011 Annual Report Download - page 112
Download and view the complete annual report
Please find page 112 of the 2011 Kroger annual report below. You can navigate through the pages in the report by either clicking on the pages listed below, or by using the keyword search tool below to find specific information within the annual report.-
 1
1 -
2
-
3
-
4
-
5
-
6
-
7
-
8
-
9
-
10
-
11
-
12
-
13
-
14
-
15
-
16
-
17
-
18
-
19
-
20
-
21
-
22
-
23
-
24
-
25
-
26
-
27
-
28
-
29
-
30
-
31
-
32
-
33
-
34
-
35
-
36
-
37
-
38
-
39
-
40
-
41
-
42
-
43
-
44
-
45
-
46
-
47
-
48
-
49
-
50
-
51
-
52
-
53
-
54
-
55
-
56
-
57
-
58
-
59
-
60
-
61
-
62
-
63
-
64
-
65
-
66
-
67
-
68
-
69
-
70
-
71
-
72
-
73
-
74
-
75
-
76
-
77
-
78
-
79
-
80
-
81
-
82
-
83
-
84
-
85
-
86
-
87
-
88
-
89
-
90
-
91
-
92
-
93
-
94
-
95
-
96
-
97
-
98
-
99
-
100
-
101
-
 102
102 -
 103
103 -
 104
104 -
 105
105 -
 106
106 -
 107
107 -
 108
108 -
 109
109 -
 110
110 -
 111
111 -
 112
112 -
 113
113 -
 114
114 -
 115
115 -
 116
116 -
 117
117 -
 118
118 -
 119
119 -
 120
120 -
 121
121 -
 122
122 -
123
-
124
 |
 |

A-57
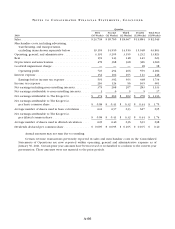
NO T E S T O CO N S O L I D A T E D FI N A N C I A L ST A T E M E N T S , CO N T I N U E D
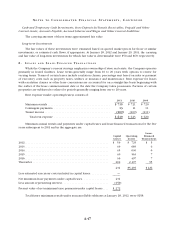
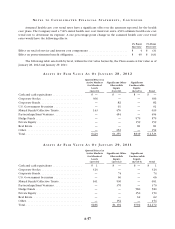
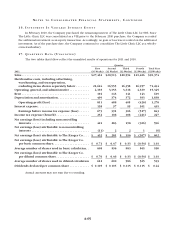
Assumed health care cost trend rates have a significant effect on the amounts reported for the health
care plans. The Company used a 7.40% initial health care cost trend rate and a 4.50% ultimate health care cost
trend rate to determine its expense. A one-percentage-point change in the assumed health care cost trend
rates would have the following effects:
1% Point
Increase
1% Point
Decrease
Effect on total of service and interest cost components . . . . . . . . . . . . . . . . . . . . . . . . . $ 4 $ (3)
Effect on postretirement benefit obligation ................................... $ 40 $ (43)
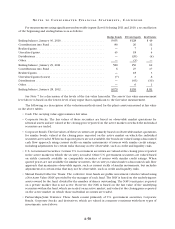
The following table sets forth by level, within the fair value hierarchy, the Plan’s assets at fair value as of
January 28, 2012 and January 29, 2011:
AS S E T S AT FA I R VA L U E AS OF JA N U A R Y 28, 2012
Quoted Prices in
Active Markets
for Identical
Assets
(Level 1)
Significant Other
Observable
Inputs
(Level 2)
Significant
Unobservable
Inputs
(Level 3) Total
Cash and cash equivalents . . . . . . . . . . . . . . . . . . . $ — $ — $ — $ —
Corporate Stocks ........................... 306 — — 306
Corporate Bonds ........................... — 82 — 82
U.S. Government Securities . . . . . . . . . . . . . . . . . . — 91 — 91
Mutual Funds/Collective Trusts . . . . . . . . . . . . . . . 143 476 — 619
Partnerships/Joint Ventures .................. — 454 — 454
Hedge Funds .............................. — — 579 579
Private Equity ............................. — — 159 159
Real Estate ................................ — — 81 81
Other .................................... — 152 — 152
Total. . . . . . . . . . . . . . . . . . . . . . . . . . . . . . . . . . . . . $449 $1,255 $819 $ 2,523
AS S E T S AT FA I R VA L U E AS OF JA N U A R Y 29, 2011
Quoted Prices in
Active Markets
for Identical
Assets
(Level 1)
Significant Other
Observable
Inputs
(Level 2)
Significant
Unobservable
Inputs
(Level 3) Total
Cash and cash equivalents . . . . . . . . . . . . . . . . . . . $ 1 $ — $ — $ 1
Corporate Stocks ........................... 324 — — 324
Corporate Bonds ........................... — 74 — 74
U.S. Government Securities . . . . . . . . . . . . . . . . . . — 66 — 66
Mutual Funds/Collective Trusts . . . . . . . . . . . . . . . 161 530 — 691
Partnerships/Joint Ventures .................. — 370 — 370
Hedge Funds .............................. — — 580 580
Private Equity ............................. — — 150 150
Real Estate ................................ — — 62 62
Other .................................... — 154 — 154
Total. . . . . . . . . . . . . . . . . . . . . . . . . . . . . . . . . . . . . $486 $1,194 $792 $ 2,472