Kroger 2011 Annual Report Download - page 62
Download and view the complete annual report
Please find page 62 of the 2011 Kroger annual report below. You can navigate through the pages in the report by either clicking on the pages listed below, or by using the keyword search tool below to find specific information within the annual report.-
 1
1 -
2
-
3
-
4
-
5
-
6
-
7
-
8
-
9
-
10
-
11
-
12
-
13
-
14
-
15
-
16
-
17
-
18
-
19
-
20
-
21
-
22
-
23
-
24
-
25
-
26
-
27
-
28
-
29
-
30
-
31
-
32
-
33
-
34
-
35
-
36
-
37
-
38
-
39
-
40
-
41
-
42
-
43
-
44
-
45
-
46
-
47
-
48
-
49
-
50
-
51
-
 52
52 -
 53
53 -
 54
54 -
 55
55 -
 56
56 -
 57
57 -
 58
58 -
 59
59 -
 60
60 -
 61
61 -
 62
62 -
 63
63 -
 64
64 -
 65
65 -
 66
66 -
 67
67 -
 68
68 -
 69
69 -
 70
70 -
 71
71 -
 72
72 -
73
-
74
-
75
-
76
-
77
-
78
-
79
-
80
-
81
-
82
-
83
-
84
-
85
-
86
-
87
-
88
-
89
-
90
-
91
-
92
-
93
-
94
-
95
-
96
-
97
-
98
-
99
-
100
-
101
-
102
-
103
-
104
-
105
-
106
-
107
-
108
-
109
-
110
-
111
-
112
-
113
-
114
-
115
-
116
-
117
-
118
-
119
-
120
-
121
-
122
-
123
-
124
 |
 |
A-7
MA N A G E M E N T ’S DI S C U S S I O N A N D AN A L Y S I S O F
FI N A N C I A L CO N D I T I O N A N D RE S U L T S O F OP E R A T I O N S
OU R BU S I N E S S
The Kroger Co. was founded in 1883 and incorporated in 1902. It is one of the nation’s largest retailers,
as measured by revenue, operating 2,435 supermarket and multi-department stores under two dozen banners
including Kroger, City Market, Dillons, Jay C, Food 4 Less, Fred Meyer, Fry’s, King Soopers, QFC, Ralphs and
Smith’s. Of these stores, 1,090 have fuel centers. We also operate 791 convenience stores, either directly or
through franchisees, and 348 fine jewelry stores.
Kroger operates 39 manufacturing plants, primarily bakeries and dairies, which supply approximately
40% of the corporate brand units sold in our retail outlets.
Our revenues are earned and cash is generated as consumer products are sold to customers in our
stores. We earn income predominately by selling products at price levels that produce revenues in excess of
the costs we incur to make these products available to our customers. Such costs include procurement and
distribution costs, facility occupancy and operational costs, and overhead expenses. Our retail operations,
which represent over 99% of Kroger’s consolidated sales and EBITDA, are our only reportable segment.
OU R 2011 PE R F O R M A N C E
We achieved solid results in 2011. Our results reflect the balance we seek to achieve across our business
including positive identical sales growth, increases in loyal household count, good cost control, as well as
growth in earnings and earnings per diluted share. Our 2011 net earnings were $602 million or $1.01 per
diluted share. The results included a charge related to the consolidation of multi-employer pension plans to
which we contribute totaling $953 million, pre-tax ($591 million after-tax). Excluding the charge, our adjusted
net earnings were $1.2 billion or $2.00 per diluted share. Our identical supermarket sales increased by 4.9%,
excluding fuel. We have achieved 33 consecutive quarters of positive identical sales growth, excluding fuel. As
we continue to outpace many of our competitors on identical sales growth, we continue to gain market share.
We focus on identical supermarket sales growth, excluding fuel, because our business model emphasizes this
primary component, and identical sales generate earnings and free cash flow that reward our shareholders.
Increasing market share is an important part of our long-term strategy as it best reflects how our products
and services resonate with customers. Market share growth allows us to spread the fixed costs in our business
over a wider revenue base. Our fundamental operating philosophy is to maintain and increase market
share by offering customers good prices and superior products and service. Based on Nielsen Homescan
Data, our estimated market share increased in total by approximately 50 basis points in 2011 across our
19 marketing areas outlined by the Nielsen report. This information also indicates that our market share
increased in 13 of the marketing areas and declined in six. Wal-Mart supercenters are a primary competitor
in 17 of our 19 marketing areas. Our overall market share grew by approximately 40 basis points in 2011 in
those 17 marketing areas. Nielsen Homescan Data is generated by customers who self-report their grocery
purchases to Nielsen, regardless of retail channel or grocery outlet. These market share results reflect our
long-term strategy of market share growth.
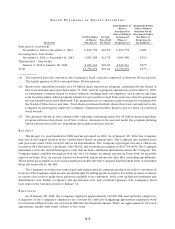
RE S U L T S O F OP E R A T I O N S
The following discussion summarizes our operating results for 2011 compared to 2010 and for 2010
compared to 2009. Comparability is affected by income and expense items that fluctuated significantly
between and among the periods.
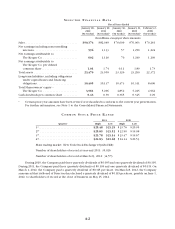
Net Earnings
Net earnings totaled $602 million in 2011, $1.1 billion in 2010 and $70 million in 2009. The net earnings
for 2011 include the UFCW consolidated pension plan charge totaling $591 million, after-tax. The net earnings
for 2010 include a non-cash goodwill impairment charge totaling $12 million, after-tax, related to a small
number of stores. The net earnings for 2009 include non-cash asset impairment charges totaling $1.05 billion,
after-tax, related to a division in southern California. The 2009 impairment charge primarily resulted from the