Kroger 2011 Annual Report Download - page 72
Download and view the complete annual report
Please find page 72 of the 2011 Kroger annual report below. You can navigate through the pages in the report by either clicking on the pages listed below, or by using the keyword search tool below to find specific information within the annual report.-
 1
1 -
2
-
3
-
4
-
5
-
6
-
7
-
8
-
9
-
10
-
11
-
12
-
13
-
14
-
15
-
16
-
17
-
18
-
19
-
20
-
21
-
22
-
23
-
24
-
25
-
26
-
27
-
28
-
29
-
30
-
31
-
32
-
33
-
34
-
35
-
36
-
37
-
38
-
39
-
40
-
41
-
42
-
43
-
44
-
45
-
46
-
47
-
48
-
49
-
50
-
51
-
52
-
53
-
54
-
55
-
56
-
57
-
58
-
59
-
60
-
61
-
 62
62 -
 63
63 -
 64
64 -
 65
65 -
 66
66 -
 67
67 -
 68
68 -
 69
69 -
 70
70 -
 71
71 -
 72
72 -
 73
73 -
 74
74 -
 75
75 -
 76
76 -
 77
77 -
 78
78 -
 79
79 -
 80
80 -
 81
81 -
 82
82 -
83
-
84
-
85
-
86
-
87
-
88
-
89
-
90
-
91
-
92
-
93
-
94
-
95
-
96
-
97
-
98
-
99
-
100
-
101
-
102
-
103
-
104
-
105
-
106
-
107
-
108
-
109
-
110
-
111
-
112
-
113
-
114
-
115
-
116
-
117
-
118
-
119
-
120
-
121
-
122
-
123
-
124
 |
 |
A-17
Uncertain Tax Positions
We review the tax positions taken or expected to be taken on tax returns to determine whether and
to what extent a benefit can be recognized in our consolidated financial statements. Refer to Note 4 to the
Consolidated Financial Statements for the amount of unrecognized tax benefits and other related disclosures
related to uncertain tax positions.
Various taxing authorities periodically audit our income tax returns. These audits include questions
regarding our tax filing positions, including the timing and amount of deductions and the allocation of income
to various tax jurisdictions. In evaluating the exposures connected with these various tax filing positions,
including state and local taxes, we record allowances for probable exposures. A number of years may elapse
before a particular matter, for which an allowance has been established, is audited and fully resolved. As of
January 28, 2012, the most recent examination concluded by the Internal Revenue Service covered the years
2005 through 2007.
The assessment of our tax position relies on the judgment of management to estimate the exposures
associated with our various filing positions.
Share-Based Compensation Expense
We account for stock options under the fair value recognition provisions of GAAP. Under this method,
we recognize compensation expense for all share-based payments granted. We recognize share-based
compensation expense, net of an estimated forfeiture rate, over the requisite service period of the award. In
addition, we record expense for restricted stock awards in an amount equal to the fair market value of the
underlying stock on the grant date of the award, over the period the award restrictions lapse.
Inventories
Inventories are stated at the lower of cost (principally on a LIFO basis) or market. In total, approximately
97% of inventories were valued using the LIFO method in both 2011 and 2010. Cost for the balance of the
inventories was determined using the FIFO method. Replacement cost was higher than the carrying amount
by $1.0 billion at January 28, 2012, and by $827 million at January 29, 2011. We follow the Link-Chain,
Dollar-Value LIFO method for purposes of calculating our LIFO charge or credit.
We follow the item-cost method of accounting to determine inventory cost before the LIFO adjustment
for substantially all store inventories at our supermarket divisions. This method involves counting each item in
inventory, assigning costs to each of these items based on the actual purchase costs (net of vendor allowances
and cash discounts) of each item and recording the cost of items sold. The item-cost method of accounting
allows for more accurate reporting of periodic inventory balances and enables management to more precisely
manage inventory and purchasing levels when compared to the methodology followed under the retail method
of accounting.
We evaluate inventory shortages throughout the year based on actual physical counts in our facilities.
We record allowances for inventory shortages based on the results of recent physical counts to provide for
estimated shortages from the last physical count to the financial statement date.
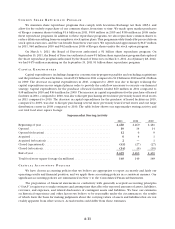
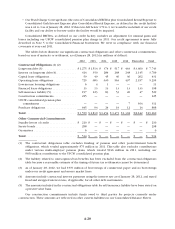
Vendor Allowances
We recognize all vendor allowances as a reduction in merchandise costs when the related product is sold.
In most cases, vendor allowances are applied to the related product cost by item, and therefore reduce the
carrying value of inventory by item. When it is not practicable to allocate vendor allowances to the product
by item, we recognize vendor allowances as a reduction in merchandise costs based on inventory turns and
as the product is sold. We recognized approximately $5.9 billion in 2011, $6.4 billion in 2010 and $5.7 billion
in 2009 of vendor allowances as a reduction in merchandise costs. We recognized approximately95% of all
vendor allowances in the item cost with the remainder being based on inventory turns.