Kroger 2011 Annual Report Download - page 105
Download and view the complete annual report
Please find page 105 of the 2011 Kroger annual report below. You can navigate through the pages in the report by either clicking on the pages listed below, or by using the keyword search tool below to find specific information within the annual report.-
 1
1 -
2
-
3
-
4
-
5
-
6
-
7
-
8
-
9
-
10
-
11
-
12
-
13
-
14
-
15
-
16
-
17
-
18
-
19
-
20
-
21
-
22
-
23
-
24
-
25
-
26
-
27
-
28
-
29
-
30
-
31
-
32
-
33
-
34
-
35
-
36
-
37
-
38
-
39
-
40
-
41
-
42
-
43
-
44
-
45
-
46
-
47
-
48
-
49
-
50
-
51
-
52
-
53
-
54
-
55
-
56
-
57
-
58
-
59
-
60
-
61
-
62
-
63
-
64
-
65
-
66
-
67
-
68
-
69
-
70
-
71
-
72
-
73
-
74
-
75
-
76
-
77
-
78
-
79
-
80
-
81
-
82
-
83
-
84
-
85
-
86
-
87
-
88
-
89
-
90
-
91
-
92
-
93
-
94
-
 95
95 -
 96
96 -
 97
97 -
 98
98 -
 99
99 -
 100
100 -
 101
101 -
 102
102 -
 103
103 -
 104
104 -
 105
105 -
 106
106 -
 107
107 -
 108
108 -
 109
109 -
 110
110 -
 111
111 -
 112
112 -
 113
113 -
 114
114 -
 115
115 -
116
-
117
-
118
-
119
-
120
-
121
-
122
-
123
-
124
 |
 |

A-50
NO T E S T O CO N S O L I D A T E D FI N A N C I A L ST A T E M E N T S , CO N T I N U E D
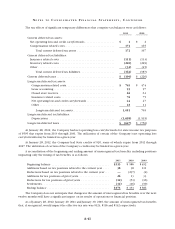
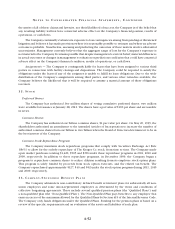
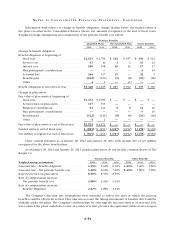
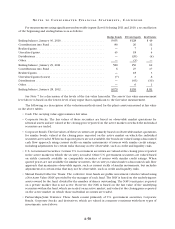
Restricted stock
Restricted
shares
outstanding
(in millions)
Weighted-
average
grant-date
fair value
Outstanding, year-end 2008 ...................................... 4.1 $27.22
Granted .................................................... 2.6 $22.22
Lapsed ..................................................... (2.2) $27.33
Canceled or Expired .......................................... (0.1) $25.33
Outstanding, year-end 2009 ...................................... 4.4 $24.25
Granted .................................................... 2.4 $20.25
Lapsed ..................................................... (2.3) $23.62
Canceled or Expired .......................................... (0.1) $23.13
Outstanding, year-end 2010....................................... 4.4 $22.39
Granted .................................................... 2.5 $24.63
Lapsed ..................................................... (2.5) $21.96
Canceled or Expired .......................................... (0.2) $23.80
Outstanding, year-end 2011....................................... 4.2 $23.92
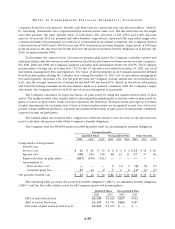
The weighted-average fair value of stock options granted during 2011, 2010 and 2009 was $6.00, $5.12
and $6.29, respectively. The fair value of each stock option grant was estimated on the date of grant using the
Black-Scholes option-pricing model, based on the assumptions shown in the table below. The Black-Scholes
model utilizes extensive judgment and financial estimates, including the term employees are expected
to retain their stock options before exercising them, the volatility of the Company’s stock price over that
expected term, the dividend yield over the term and the number of awards expected to be forfeited before
they vest. Using alternative assumptions in the calculation of fair value would produce fair values for stock
option grants that could be different than those used to record stock-based compensation expense in the
Consolidated Statements of Operations. The increase in the fair value of the stock options granted in 2011,
compared to 2010, resulted primarily from an increase in the Company’s share price. The decrease in the fair
value of the stock options granted during 2010, compared to 2009, resulted primarily from a decrease in the
Company’s share price.
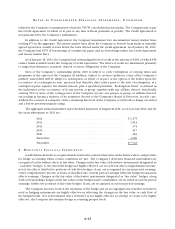
The following table reflects the weighted-average assumptions used for grants awarded to option
holders:
2011 2010 2009
Weighted average expected volatility .................. 26.31% 26.87% 28.06%
Weighted average risk-free interest rate ................ 2.16% 2.57% 3.17%
Expected dividend yield ............................ 1.90% 2.00% 1.80%
Expected term (based on historical results) . . . . . . . . . . . . 6.9 years 6.9 years 6.8 years
The weighted-average risk-free interest rate was based on the yield of a treasury note as of the grant date,
continuously compounded, which matures at a date that approximates the expected term of the options.
The dividend yield was based on our history and expectation of dividend payouts. Expected volatility was
determined based upon historical stock volatilities; however, implied volatility was also considered. Expected
term was determined based upon a combination of historical exercise and cancellation experience as well as
estimates of expected future exercise and cancellation experience.