Kroger 2011 Annual Report Download - page 110
Download and view the complete annual report
Please find page 110 of the 2011 Kroger annual report below. You can navigate through the pages in the report by either clicking on the pages listed below, or by using the keyword search tool below to find specific information within the annual report.-
 1
1 -
2
-
3
-
4
-
5
-
6
-
7
-
8
-
9
-
10
-
11
-
12
-
13
-
14
-
15
-
16
-
17
-
18
-
19
-
20
-
21
-
22
-
23
-
24
-
25
-
26
-
27
-
28
-
29
-
30
-
31
-
32
-
33
-
34
-
35
-
36
-
37
-
38
-
39
-
40
-
41
-
42
-
43
-
44
-
45
-
46
-
47
-
48
-
49
-
50
-
51
-
52
-
53
-
54
-
55
-
56
-
57
-
58
-
59
-
60
-
61
-
62
-
63
-
64
-
65
-
66
-
67
-
68
-
69
-
70
-
71
-
72
-
73
-
74
-
75
-
76
-
77
-
78
-
79
-
80
-
81
-
82
-
83
-
84
-
85
-
86
-
87
-
88
-
89
-
90
-
91
-
92
-
93
-
94
-
95
-
96
-
97
-
98
-
99
-
 100
100 -
 101
101 -
 102
102 -
 103
103 -
 104
104 -
 105
105 -
 106
106 -
 107
107 -
 108
108 -
 109
109 -
 110
110 -
 111
111 -
 112
112 -
 113
113 -
 114
114 -
 115
115 -
 116
116 -
 117
117 -
 118
118 -
 119
119 -
 120
120 -
121
-
122
-
123
-
124
 |
 |

A-55
NO T E S T O CO N S O L I D A T E D FI N A N C I A L ST A T E M E N T S , CO N T I N U E D
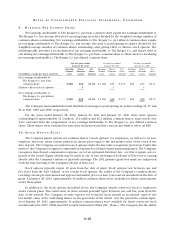
corporate bonds for each maturity. Benefit cash flows due in a particular year can theoretically be “settled”
by “investing” them in the zero-coupon bond that matures in the same year. The discount rates are the single
rates that produce the same present value of cash flows. The selection of the 4.55% and 4.40% discount
rates as of year-end 2011 for pension and other benefits, respectively, represents the equivalent single rates
constructed under a broad-market AA yield curve constructed by an outside consultant. The Company utilized
a discount rate of 5.60% and 5.40% for year-end 2010 for pension and other benefits, respectively. A 100 basis
point increase in the discount rate would decrease the projected pension benefit obligation as of January 28,
2012, by approximately $406.
To determine the expected rate of return on pension plan assets, the Company considers current and
anticipated plan asset allocations as well as historical and forecasted rates of return on various asset categories.
For 2011, 2010 and 2009, the Company assumed a pension plan investment return rate of 8.5%. The Company
pension plan’s average rate of return was 7.2% for the 10 calendar years ended December 31, 2011, net of all
investment management fees and expenses. The value of all investments in its Company-sponsored defined
benefit pension plans during the calendar year ending December 31, 2011, net of investment management
fees and expenses, increased 1.6%. For the past 20 years, the Company average annual rate of return has been
9.4%, and the average annual rate of return for the S&P 500 has been 8.7%. Based on the above information
and forward looking assumptions for investments made in a manner consistent with the Company’s target
allocations, the Company believes an 8.5% rate of return assumption is reasonable.
The Company calculates its expected return on plan assets by using the market-related value of plan
assets. The market-related value of plan assets is determined by adjusting the actual fair value of plan assets for
gains or losses on plan assets. Gains or losses represent the difference between actual and expected returns
on plan investments for each plan year. Gains or losses on plan assets are recognized evenly over a five year
period. Using a different method to calculate the market-related value of plan assets would provide a different
expected return on plan assets.
The funded status decreased in 2011 compared to 2010 due mostly to the decrease in the discount rate
used to calculate the present value of the Company’s benefit obligation.
The Company uses the RP-2000 projected 2018 mortality table in calculating the pension obligation.
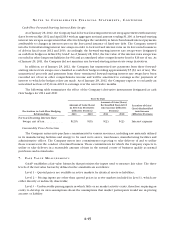
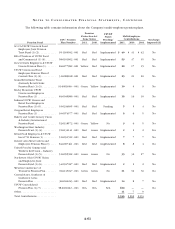
Pension Benefits
Qualified Plans Non-Qualified Plan Other Benefits
2011 2010 2009 2011 2010 2009 2011 2010 2009
Components of net periodic
benefit cost:
Service cost...................... $ 41 $ 40 $ 35 $ 3 $ 2 $ 2 $ 13 $ 12 $ 10
Interest cost ..................... 158 158 158 10 12 11 17 17 18
Expected return on plan assets....... (207) (196) (191) —— — —— —
Amortization of:
Prior service cost............... —— — 1(1) 2 (5) (5) (7)
Actuarial (gain) loss ............. 57 44 8 76 6 (2) (3) (5)
Net periodic benefit cost .............. $ 49 $ 46 $ 10 $ 21 $ 19 $ 21 $ 23 $ 21 $ 16
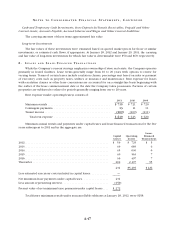
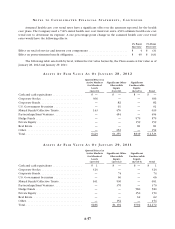
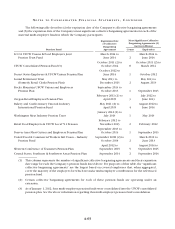
The following table provides the projected benefit obligation (“PBO”), accumulated benefit obligation
(“ABO”) and the fair value of plan assets for all Company-sponsored pension plans.
Qualified Plans Non-Qualified Plan
2011 2010 2011 2010
PBO at end of fiscal year .................... $3,348 $ 2,923 $217 $192
ABO at end of fiscal year .................... $3,147 $ 2,743 $209 $187
Fair value of plan assets at end of year ......... $2,523 $ 2,472 $ — $ —