Kroger 2011 Annual Report Download - page 26
Download and view the complete annual report
Please find page 26 of the 2011 Kroger annual report below. You can navigate through the pages in the report by either clicking on the pages listed below, or by using the keyword search tool below to find specific information within the annual report.-
 1
1 -
2
-
3
-
4
-
5
-
6
-
7
-
8
-
9
-
10
-
11
-
12
-
13
-
14
-
15
-
 16
16 -
 17
17 -
 18
18 -
 19
19 -
 20
20 -
 21
21 -
 22
22 -
 23
23 -
 24
24 -
 25
25 -
 26
26 -
 27
27 -
 28
28 -
 29
29 -
 30
30 -
 31
31 -
 32
32 -
 33
33 -
 34
34 -
 35
35 -
 36
36 -
37
-
38
-
39
-
40
-
41
-
42
-
43
-
44
-
45
-
46
-
47
-
48
-
49
-
50
-
51
-
52
-
53
-
54
-
55
-
56
-
57
-
58
-
59
-
60
-
61
-
62
-
63
-
64
-
65
-
66
-
67
-
68
-
69
-
70
-
71
-
72
-
73
-
74
-
75
-
76
-
77
-
78
-
79
-
80
-
81
-
82
-
83
-
84
-
85
-
86
-
87
-
88
-
89
-
90
-
91
-
92
-
93
-
94
-
95
-
96
-
97
-
98
-
99
-
100
-
101
-
102
-
103
-
104
-
105
-
106
-
107
-
108
-
109
-
110
-
111
-
112
-
113
-
114
-
115
-
116
-
117
-
118
-
119
-
120
-
121
-
122
-
123
-
124
 |
 |

24
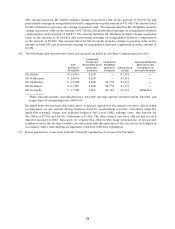
The 2011 targets established by the Committee for annual bonus amounts based on identical sales and
EBITDA results, the actual 2011 results, and the bonus percentage earned in each of the components of named
executive officer bonus, were as follows:
Targets
Component Minimum 100% Result Amount Earned
Identical Sales ...................... 1.5% 3.5% 4.9% 44.034%
EBITDA . . . . . . . . . . . . . . . . . . . . . . . . . . . $3.246 Billion $3.819 Billion* $3.899 Billion 40.700%
Strategic Plan** . . . . . . . . . . . . . . . . . . . . . 48.932%
Fuel Bonus ......................... [as described in the text above] 5.000%
138.666%
* Payout is at 125% if identical sales goal is achieved.
** The Strategic Plan component also was established by the Committee but is not disclosed as it is
competitively sensitive.
In 2011, as in all years, the Committee retained discretion to reduce the bonus payout for all executive
officers, including the named executive officers, if the Committee determined for any reason that the bonus
payouts were not appropriate. The independent directors retained that discretion for the CEO’s bonus. Those
bodies also retained discretion to adjust the targets under the plan should unanticipated developments arise
during the year. No adjustments were made to the targets. The Committee, and the independent directors in
the case of the CEO, determined that the bonus payouts for the named executive officers should remain the
same as other participants.
The percentage paid for 2011 represented and resulted from performance that significantly exceeded
our business plan objectives. A comparison of bonus percentages for the named executive officers in prior
years demonstrates the variability of incentive compensation:
Fiscal Year
Annual Cash Bonus
Percentage
2011 138.666%
2010 53.868%
2009 38.450%
2008 104.948%
2007 128.104%
2006 141.118%
2005 132.094%
2004 55.174%
2003 24.100%
2002 9.900%
The actual amounts of annual performance-based cash bonuses paid to the named executive officers
for 2011 are shown in the Summary Compensation Table under the heading “Non-Equity Incentive Plan
Compensation.” These amounts represent the bonus potentials for each named executive officer multiplied
by the percentage earned in 2011. In no event can any participant receive a performance-based annual cash
bonus in excess of $5,000,000. The maximum amount that a participant, including each named executive
officer, can earn is further limited to 200% of the participant’s potential amount.
The performance-based annual cash bonus for 2012 will be determined based on Kroger’s performance
against the identical sales, EBITDA, and strategic plan objectives established by the Committee. Each of these
metrics will be weighted the same to indicate to the organization the equal importance that each measure
has to Kroger’s overall strategy. The underlying strategy metrics have been revised from prior years to focus
on shorter-term measures, as the long-term bonus emphasizes long-term performance. The 2012 plan also
provides for an additional 5% payout if our goals for supermarket fuel EBITDA, supermarket fuel sales, and
targeted number of fuel centers in operation at the fiscal year end are achieved.