Kroger 2011 Annual Report Download - page 78
Download and view the complete annual report
Please find page 78 of the 2011 Kroger annual report below. You can navigate through the pages in the report by either clicking on the pages listed below, or by using the keyword search tool below to find specific information within the annual report.A-23
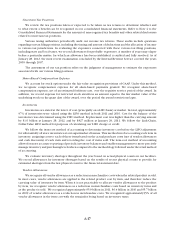
• Weexpectnetearningsperdilutedshareintherangeof$2.28-$2.38for2012.Thisguidanceassumesthe
benefit of the 53rd week, a lower expected LIFO charge, the benefit of our share buyback program during
2011, the benefit from the pension plan consolidation and the benefit from transfers of prescriptions to
our stores from customers that previously used a former third party pharmacy provider to obtain their
Express Scripts benefits.
• Weexpectidenticalsupermarketsalesgrowth,excludingfuelsales,of3.0%-3.5%in2012.Thisguidance
contemplates the effect of several brand prescription drugs coming off patent during 2012, which will
reduce sales because generic equivalents have a lower retail price.
• Our business model is designed to produce annual earnings per diluted share growth on average of
6.0% to 8.0% over a rolling three to five year time horizon. Including our dividend, our business model
is designed to generate total shareholder return on average of 8.0% to 10.0% over a rolling three to five
year time period. In 2012, annual earnings per diluted share growth are expected to be higher than this
due to a combination of the benefit of the 53rd week, a lower expected LIFO charge, the benefit of our
share buyback program during 2011, the benefits from the pension plan consolidation and the benefit
from Express Scripts prescription transfers.
• For2012,weintendtocontinuetofocusonimprovingsalesgrowth,inaccordancewithourCustomer
1st strategy, by making investments in gross margin and customer shopping experiences. We expect to
finance these investments primarily with operating cost reductions. We expect FIFO non-fuel operating
margins for 2012 to expand slightly compared to 2011, excluding the UFCW consolidated pension plan
charge in 2011.
• For2012,weexpectourannualizedLIFOchargetobeapproximately$140millionto$190million.This
forecast is based on estimated cost changes for products in our inventory.
• For2012,weexpectinterestexpensetobeapproximately$450million.
• Weplantousecashflowprimarilyforcapitalinvestments,tomaintainourcurrentdebtcoverageratios,
to pay cash dividends, and to repurchase stock. As market conditions change, we re-evaluate these uses
of cash flow.
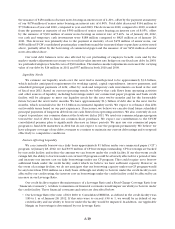
• Weexpecttoobtainsalesgrowthfromnewsquarefootage,aswellasfromincreasedproductivityfrom
existing locations.
• Capitalexpendituresreflectourstrategyofgrowththroughexpansion,aswellasfocusingonproductivity
increases from our existing store base through remodels. In addition, we intend to continue our
emphasis on self-development and ownership of real estate, and logistics and technology improvements.
The continued capital spending in technology is focused on improving store operations, logistics,
manufacturing procurement, category management, merchandising and buying practices, and should
reduce merchandising costs. We intend to continue using cash flow from operations to finance capital
expenditure requirements. We expect capital investments for 2012 to be in the range of $1.9-$2.2 billion,
excluding acquisitions and purchases of leased facilities. We expect total food store square footage to
grow approximately 1.3%-1.5% before acquisitions and operational closings.
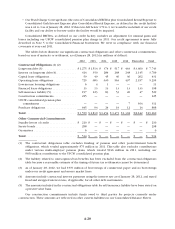
• Based on current operating trends, we believe that cash flow from operations and other sources of
liquidity, including borrowings under our commercial paper program and bank credit facility, will be
adequate to meet anticipated requirements for working capital, capital expenditures, interest payments
and scheduled principal payments for the foreseeable future. We also believe we have adequate coverage
of our debt covenants to continue to respond effectively to competitive conditions.
• Webelievewehaveadequatesourcesofcash,ifneeded,underourcreditfacilityandotherborrowing
sources for the next twelve months and for the foreseeable future beyond the next twelve months.
• WeexpectthatourOG&Aresultswillbeaffectedbyincreasedcosts,suchashigheremployeebenefit
costs and credit card fees, offset by improved productivity from process changes and leverage gained
through sales increases.


