Kroger 2011 Annual Report Download - page 109
Download and view the complete annual report
Please find page 109 of the 2011 Kroger annual report below. You can navigate through the pages in the report by either clicking on the pages listed below, or by using the keyword search tool below to find specific information within the annual report.-
 1
1 -
2
-
3
-
4
-
5
-
6
-
7
-
8
-
9
-
10
-
11
-
12
-
13
-
14
-
15
-
16
-
17
-
18
-
19
-
20
-
21
-
22
-
23
-
24
-
25
-
26
-
27
-
28
-
29
-
30
-
31
-
32
-
33
-
34
-
35
-
36
-
37
-
38
-
39
-
40
-
41
-
42
-
43
-
44
-
45
-
46
-
47
-
48
-
49
-
50
-
51
-
52
-
53
-
54
-
55
-
56
-
57
-
58
-
59
-
60
-
61
-
62
-
63
-
64
-
65
-
66
-
67
-
68
-
69
-
70
-
71
-
72
-
73
-
74
-
75
-
76
-
77
-
78
-
79
-
80
-
81
-
82
-
83
-
84
-
85
-
86
-
87
-
88
-
89
-
90
-
91
-
92
-
93
-
94
-
95
-
96
-
97
-
98
-
 99
99 -
 100
100 -
 101
101 -
 102
102 -
 103
103 -
 104
104 -
 105
105 -
 106
106 -
 107
107 -
 108
108 -
 109
109 -
 110
110 -
 111
111 -
 112
112 -
 113
113 -
 114
114 -
 115
115 -
 116
116 -
 117
117 -
 118
118 -
 119
119 -
120
-
121
-
122
-
123
-
124
 |
 |

A-54
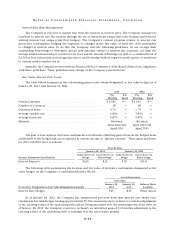
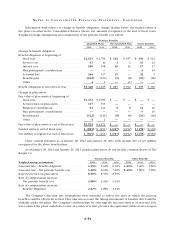
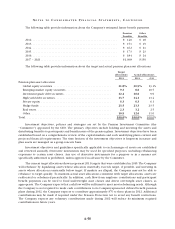
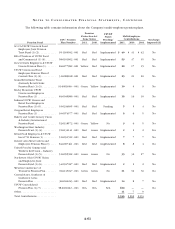
NO T E S T O CO N S O L I D A T E D FI N A N C I A L ST A T E M E N T S , CO N T I N U E D
Information with respect to change in benefit obligation, change in plan assets, the funded status of
the plans recorded in the Consolidated Balance Sheets, net amounts recognized at the end of fiscal years,
weighted average assumptions and components of net periodic benefit cost follow:
Pension Benefits
Qualified Plans Non-Qualified Plan Other Benefits
2011 2010 2011 2010 2011 2010
Change in benefit obligation:
Benefit obligation at beginning of
fiscal year .............................. $2,923 $ 2,706 $ 192 $ 187 $ 330 $ 312
Service cost ............................ 41 40 3213 12
Interest cost ............................ 158 158 10 12 17 17
Plan participants’ contributions ............. ————910
Actuarial loss ........................... 344 137 21 —32 5
Benefits paid ........................... (122) (120) (9) (8) (23) (26)
Other ................................. 42—(1) ——
Benefit obligation at end of fiscal year .......... $3,348 $ 2,923 $ 217 $ 192 $ 378 $ 330
Change in plan assets:
Fair value of plan assets at beginning of
fiscal year .............................. $2,472 $ 2,096 $ — $ — $ — $ —
Actual return on plan assets ................ 117 353 ————
Employer contributions ................... 52 141 9814 16
Plan participants’ contributions ............. ————910
Benefits paid ........................... (122) (120) (9) (8) (23) (26)
Other ................................. 42————
Fair value of plan assets at end of fiscal year . . . . . $2,523 $ 2,472 $ — $ — $ — $ —
Funded status at end of fiscal year . . . . . . . . . . . . . $ (825) $ (451) $ (217) $(192) $ (378) $(330)
Net liability recognized at end of fiscal year . . . . . $ (825) $ (451) $ (217) $(192) $ (378) $(330)
Other current liabilities as of January 28, 2012 and January 29, 2011 both include $27 of net liability
recognized for the above benefit plans.
As of January 28, 2012 and January 29, 2011, pension plan assets do not include common shares of The
Kroger Co.
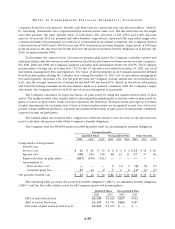
Pension Benefits Other Benefits
Weighted average assumptions 2011 2010 2009 2011 2010 2009
Discount rate – Benefit obligation . . . . . . . . . . . . . . 4.55% 5.60% 6.00% 4.40% 5.40% 5.80%
Discount rate – Net periodic benefit cost . . . . . . . . 5.60% 6.00% 7.00% 5.40% 5.80% 7.00%
Expected return on plan assets . . . . . . . . . . . . . . . . 8.50% 8.50% 8.50%
Rate of compensation increase –
Net periodic benefit cost ................... 2.88% 2.92% 2.92%
Rate of compensation increase –
Benefit Obligation ........................ 2.82% 2.88% 2.92%
The Company’s discount rate assumptions were intended to reflect the rates at which the pension
benefits could be effectively settled. They take into account the timing and amount of benefits that would be
available under the plans. The Company’s methodology for selecting the discount rates as of year-end 2011
was to match the plan’s cash flows to that of a yield curve that provides the equivalent yields on zero-coupon