Kroger 2011 Annual Report Download - page 63
Download and view the complete annual report
Please find page 63 of the 2011 Kroger annual report below. You can navigate through the pages in the report by either clicking on the pages listed below, or by using the keyword search tool below to find specific information within the annual report.-
 1
1 -
2
-
3
-
4
-
5
-
6
-
7
-
8
-
9
-
10
-
11
-
12
-
13
-
14
-
15
-
16
-
17
-
18
-
19
-
20
-
21
-
22
-
23
-
24
-
25
-
26
-
27
-
28
-
29
-
30
-
31
-
32
-
33
-
34
-
35
-
36
-
37
-
38
-
39
-
40
-
41
-
42
-
43
-
44
-
45
-
46
-
47
-
48
-
49
-
50
-
51
-
52
-
 53
53 -
 54
54 -
 55
55 -
 56
56 -
 57
57 -
 58
58 -
 59
59 -
 60
60 -
 61
61 -
 62
62 -
 63
63 -
 64
64 -
 65
65 -
 66
66 -
 67
67 -
 68
68 -
 69
69 -
 70
70 -
 71
71 -
 72
72 -
 73
73 -
74
-
75
-
76
-
77
-
78
-
79
-
80
-
81
-
82
-
83
-
84
-
85
-
86
-
87
-
88
-
89
-
90
-
91
-
92
-
93
-
94
-
95
-
96
-
97
-
98
-
99
-
100
-
101
-
102
-
103
-
104
-
105
-
106
-
107
-
108
-
109
-
110
-
111
-
112
-
113
-
114
-
115
-
116
-
117
-
118
-
119
-
120
-
121
-
122
-
123
-
124
 |
 |

A-8
write-off of the Ralphs division goodwill balance. Excluding these charges for 2011, 2010 and 2009, adjusted
net earnings were $1.2 billion in 2011 and $1.1 billion in both 2010 and 2009. 2011 adjusted net earnings
improved, compared to 2010, due to an increase in FIFO non-fuel operating profit, lower interest expense,
favorable resolutions for certain tax issues, and higher retail fuel margins, partially offset by a LIFO charge of
$216 million (pre-tax), compared to a LIFO charge of $57 million (pre-tax) in 2010. 2010 adjusted net earnings
improved, compared to 2009, due to lower interest expense, favorable resolutions for certain tax issues and
higher retail fuel margins, partially offset by decreased non-fuel operating profit.
2011 net earnings per diluted share totaled $1.01, and adjusted net earnings per diluted share in 2011
totaled $2.00, which excludes the UFCW consolidated pension plan charge. 2010 net earnings per diluted
share totaled $1.74, and adjusted net earnings per diluted share in 2010 totaled $1.76, which excludes the $0.02
per diluted share for the non-cash goodwill impairment charge. Net earnings per diluted share was $0.11 in
2009, and adjusted net earnings per diluted share in 2009 was $1.71, which excludes the $1.60 per diluted
share for the non-cash asset impairment charges. Adjusted net earnings per diluted share in 2011, compared
to 2010, increased primarily due to increased retail fuel margins, the repurchase of Kroger common shares,
increased FIFO non-fuel operating profit, and the favorable resolution of certain tax issues, offset by a LIFO
charge of $216 million (pre-tax), compared to a LIFO charge of $57 million (pre-tax) in 2010. Adjusted net
earnings per diluted share in 2010, compared to 2009, increased due to increased retail fuel margins, the
favorable resolution of certain tax issues and the repurchase of Kroger common shares, partially offset by
reduced non-fuel net earnings.
Management believes adjusted net earnings (and adjusted net earnings per diluted share) are useful
metrics to investors and analysts because the one-time charges reflected in net earnings, and net earnings per
diluted share, are non-recurring and are not directly related to our day-to-day business.
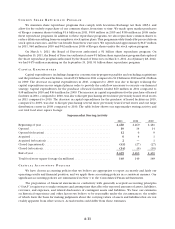
Sales
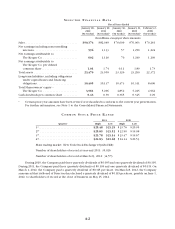
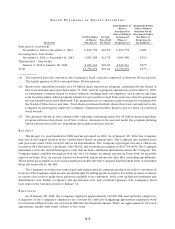
Total Sales
(in millions)
2011
Percentage
Increase 2010
Percentage
Increase 2009
Total supermarket sales without fuel ............. $ 71,109 5.0% $ 67,742 3.4% $ 65,525
Total supermarket fuel sales .................... 12,995 42.6% 9,111 36.6% 6,671
Total supermarket sales . . . . . . . . . . . . . . . . . . . . . . . $ 84,104 9.4% $ 76,853 6.5% $ 72,196
Other sales (1) ............................... 6,270 20.7% 5,196 17.7% 4,413
Total sales . . . . . . . . . . . . . . . . . . . . . . . . . . . . . . . . . . $ 90,374 10.1% $ 82,049 7.1% $ 76,609
(1) Other sales primarily relate to sales at convenience stores, including fuel; jewelry stores; manufacturing
plants to outside customers; variable interest entities; and in-store health clinics.
The increase in total sales for 2011 compared to 2010 was primarily the result of our identical supermarket
sales increase, excluding fuel, of 4.9% and an increase in supermarket fuel sales of 42.6%. Total supermarket
fuel sales increased over the same period due to a 26.3% increase in average retail fuel prices and a 13.0%
increase in fuel gallons sold. The increase in the average supermarket retail fuel price was caused by an
increase in the product cost of fuel. The increase in total supermarket sales without fuel for 2011 over 2010 was
primarily the result of increases in identical supermarket sales, excluding fuel, of 4.9%. Identical supermarket
sales, excluding fuel, increased primarily due to inflation, increased transaction count and an increase in the
average sale per shopping trip.
The increase in total sales for 2010 compared to 2009 was primarily the result of our identical supermarket
sales increase, excluding fuel, of 2.8% and an increase in supermarket fuel sales of 36.6%. Total supermarket
fuel sales increased over the same period due to a 16.8% increase in average retail fuel prices and a 17.2%
increase in fuel gallons sold. The increase in the average supermarket retail fuel price was caused by an
increase in the product cost of fuel. The increase in total supermarket sales without fuel for 2010 over 2009 was