Kroger 2011 Annual Report Download - page 64
Download and view the complete annual report
Please find page 64 of the 2011 Kroger annual report below. You can navigate through the pages in the report by either clicking on the pages listed below, or by using the keyword search tool below to find specific information within the annual report.-
 1
1 -
2
-
3
-
4
-
5
-
6
-
7
-
8
-
9
-
10
-
11
-
12
-
13
-
14
-
15
-
16
-
17
-
18
-
19
-
20
-
21
-
22
-
23
-
24
-
25
-
26
-
27
-
28
-
29
-
30
-
31
-
32
-
33
-
34
-
35
-
36
-
37
-
38
-
39
-
40
-
41
-
42
-
43
-
44
-
45
-
46
-
47
-
48
-
49
-
50
-
51
-
52
-
53
-
 54
54 -
 55
55 -
 56
56 -
 57
57 -
 58
58 -
 59
59 -
 60
60 -
 61
61 -
 62
62 -
 63
63 -
 64
64 -
 65
65 -
 66
66 -
 67
67 -
 68
68 -
 69
69 -
 70
70 -
 71
71 -
 72
72 -
 73
73 -
 74
74 -
75
-
76
-
77
-
78
-
79
-
80
-
81
-
82
-
83
-
84
-
85
-
86
-
87
-
88
-
89
-
90
-
91
-
92
-
93
-
94
-
95
-
96
-
97
-
98
-
99
-
100
-
101
-
102
-
103
-
104
-
105
-
106
-
107
-
108
-
109
-
110
-
111
-
112
-
113
-
114
-
115
-
116
-
117
-
118
-
119
-
120
-
121
-
122
-
123
-
124
 |
 |

A-9
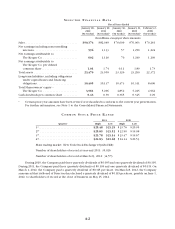
primarily the result of increases in identical supermarket sales, excluding fuel, of 2.8% as well as an increase
in supermarket square footage of 0.5%. Identical supermarket sales, excluding fuel, increased primarily due to
inflation, increased transaction count and an increase in the average sale per shopping trip.
We define a supermarket as identical when it has been in operation without expansion or relocation for
five full quarters. Fuel center discounts received at our fuel centers and earned based on in-store purchases are
included in all of the identical supermarket sales results calculations illustrated below. Differences between
total supermarket sales and identical supermarket sales primarily relate to changes in supermarket square
footage. Identical supermarket sales include all sales at identical Fred Meyer multi-department stores. We
calculate annualized identical supermarket sales by adding together four quarters of identical supermarket
sales. Our identical supermarket sales results are summarized in the table below, based on the 52-week period
of 2011, compared to the 52-week period of the previous year. The identical store count in the table below
represents the total number of identical supermarkets as of January 28, 2012 and January 29, 2011.
Identical Supermarket Sales
(dollars in millions)
2011 2010
Including supermarket fuel centers . . . . . . . . . . . $ 81,082 $ 74,243
Excluding supermarket fuel centers ........... $ 68,558 $ 65,336
Including supermarket fuel centers . . . . . . . . . . . 9.2% 5.7%
Excluding supermarket fuel centers ........... 4.9% 2.8%
Identical 4th Quarter store count ............. 2,355 2,342
FIFO Gross Margin
We calculate First-In, First-Out (“FIFO”) Gross Margin as sales minus merchandise costs, including
advertising, warehousing and transportation, but excluding the Last-In, First-Out (“LIFO”) charge. Merchandise
costs exclude depreciation and rent expense. FIFO gross margin is an important measure used by management
to evaluate merchandising and operational effectiveness.
Our FIFO gross margin rates, as a percentage of sales, were 21.13% in 2011, 22.31% in 2010 and 23.25% in
2009. Our retail fuel sales reduce our FIFO gross margin rate due to the very low FIFO gross margin on retail
fuel sales as compared to non-fuel sales. Excluding the effect of retail fuel operations, our FIFO gross margin
rates decreased 33 basis points in 2011 and 35 basis points in 2010. FIFO gross margin in 2011, compared
to 2010, decreased primarily due to continued investments in lower prices for our customers, the effect of
inflation and higher transportation expenses, partially offset by improvements in shrink, advertising, and
warehousing expenses, as a percentage of sales. FIFO gross margin in 2010, compared to 2009, decreased
primarily from continued investments in lower prices for our customers and higher transportation expenses,
as a percentage of sales.
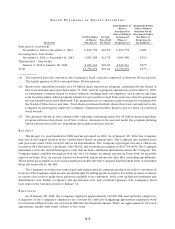
LIFO Charge
The LIFO charge was $216 million in 2011, $57 million in 2010 and $49 million in 2009. Like many food
retailers, we experienced higher levels of product cost inflation in 2011, compared to 2010. In 2011, our LIFO
charge primarily resulted from an annualized product cost inflation related to grocery, meat and seafood, deli
and bakery, and pharmacy. A slight increase in annualized product cost inflation caused the increase in the
LIFO charge in 2010, compared to 2009. In 2010, our LIFO charge primarily resulted from annualized product
cost inflation related to meat, pharmacy, and Company-manufactured products, partially offset by deflation in
grocery products. In 2009, our LIFO charge primarily resulted from annualized product cost inflation related
to tobacco and pharmacy products.
Operating, General and Administrative Expenses
Operating, general and administrative (“OG&A”) expenses consist primarily of employee-related costs
such as wages, health care benefit and retirement plan costs, utilities and credit card fees. Rent expense,
depreciation and amortization expense, and interest expense are not included in OG&A.