Kroger 2011 Annual Report Download - page 104
Download and view the complete annual report
Please find page 104 of the 2011 Kroger annual report below. You can navigate through the pages in the report by either clicking on the pages listed below, or by using the keyword search tool below to find specific information within the annual report.-
 1
1 -
2
-
3
-
4
-
5
-
6
-
7
-
8
-
9
-
10
-
11
-
12
-
13
-
14
-
15
-
16
-
17
-
18
-
19
-
20
-
21
-
22
-
23
-
24
-
25
-
26
-
27
-
28
-
29
-
30
-
31
-
32
-
33
-
34
-
35
-
36
-
37
-
38
-
39
-
40
-
41
-
42
-
43
-
44
-
45
-
46
-
47
-
48
-
49
-
50
-
51
-
52
-
53
-
54
-
55
-
56
-
57
-
58
-
59
-
60
-
61
-
62
-
63
-
64
-
65
-
66
-
67
-
68
-
69
-
70
-
71
-
72
-
73
-
74
-
75
-
76
-
77
-
78
-
79
-
80
-
81
-
82
-
83
-
84
-
85
-
86
-
87
-
88
-
89
-
90
-
91
-
92
-
93
-
 94
94 -
 95
95 -
 96
96 -
 97
97 -
 98
98 -
 99
99 -
 100
100 -
 101
101 -
 102
102 -
 103
103 -
 104
104 -
 105
105 -
 106
106 -
 107
107 -
 108
108 -
 109
109 -
 110
110 -
 111
111 -
 112
112 -
 113
113 -
 114
114 -
115
-
116
-
117
-
118
-
119
-
120
-
121
-
122
-
123
-
124
 |
 |

A-49
NO T E S T O CO N S O L I D A T E D FI N A N C I A L ST A T E M E N T S , CO N T I N U E D
to convert shares available for stock options under the Plans to shares available for restricted stock awards.
Under some of the Plans, four shares available for option awards can be converted into one share available for
restricted stock awards.
All awards become immediately exercisable upon certain changes of control of the Company.
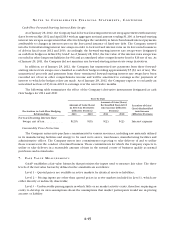
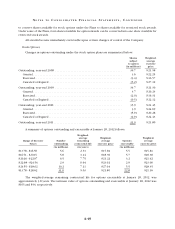
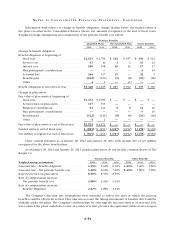
Stock Options
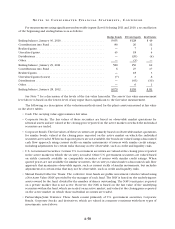
Changes in options outstanding under the stock option plans are summarized below:
Shares
subject
to option
(in millions)
Weighted-
average
exercise
price
Outstanding, year-end 2008 ........................................... 39.7 $ 21.58
Granted ......................................................... 3.6 $ 22.25
Exercised........................................................ (3.4) $ 16.57
Canceled or Expired ............................................... (5.2) $ 27.12
Outstanding, year-end 2009 ........................................... 34.7 $ 21.30
Granted ......................................................... 3.7 $ 20.23
Exercised........................................................ (2.0) $ 16.31
Canceled or Expired ............................................... (0.5) $ 22.12
Outstanding, year-end 2010 ........................................... 35.9 $ 21.45
Granted ......................................................... 3.9 $ 24.69
Exercised........................................................ (5.9) $ 20.28
Canceled or Expired ............................................... (2.9) $ 24.43
Outstanding, year-end 2011............................................ 31.0 $ 21.80
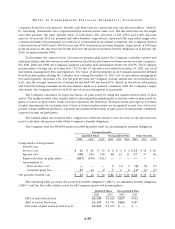
A summary of options outstanding and exercisable at January 28, 2012 follows:
Range of Exercise
Prices
Number
outstanding
Weighted-
average
remaining
contractual life
Weighted-
average
exercise price
Options
exercisable
Weighted-
average
exercise price
(in millions) (in years) (in millions)
$13.78 - $16.50 5.6 2.33 $15.81 5.5 $15.81
$16.51 - $20.15 5.8 3.14 $18.39 5.7 $18.38
$20.16 - $22.97 6.5 7.75 $21.22 3.2 $21.42
$22.98 - $24.54 2.9 0.64 $23.02 2.9 $23.00
$24.55 - $28.62 10.2 7.11 $27.04 5.5 $28.35
$13.78 - $28.62 31.0 5.03 $21.80 22.8 $21.16
The weighted-average remaining contractual life for options exercisable at January 28, 2012, was
approximately 3.8 years. The intrinsic value of options outstanding and exercisable at January 28, 2012 was
$105 and $94, respectively.