Kroger 2011 Annual Report Download - page 73
Download and view the complete annual report
Please find page 73 of the 2011 Kroger annual report below. You can navigate through the pages in the report by either clicking on the pages listed below, or by using the keyword search tool below to find specific information within the annual report.-
 1
1 -
2
-
3
-
4
-
5
-
6
-
7
-
8
-
9
-
10
-
11
-
12
-
13
-
14
-
15
-
16
-
17
-
18
-
19
-
20
-
21
-
22
-
23
-
24
-
25
-
26
-
27
-
28
-
29
-
30
-
31
-
32
-
33
-
34
-
35
-
36
-
37
-
38
-
39
-
40
-
41
-
42
-
43
-
44
-
45
-
46
-
47
-
48
-
49
-
50
-
51
-
52
-
53
-
54
-
55
-
56
-
57
-
58
-
59
-
60
-
61
-
62
-
 63
63 -
 64
64 -
 65
65 -
 66
66 -
 67
67 -
 68
68 -
 69
69 -
 70
70 -
 71
71 -
 72
72 -
 73
73 -
 74
74 -
 75
75 -
 76
76 -
 77
77 -
 78
78 -
 79
79 -
 80
80 -
 81
81 -
 82
82 -
 83
83 -
84
-
85
-
86
-
87
-
88
-
89
-
90
-
91
-
92
-
93
-
94
-
95
-
96
-
97
-
98
-
99
-
100
-
101
-
102
-
103
-
104
-
105
-
106
-
107
-
108
-
109
-
110
-
111
-
112
-
113
-
114
-
115
-
116
-
117
-
118
-
119
-
120
-
121
-
122
-
123
-
124
 |
 |

A-18
LI Q U I D I T Y A N D CA P I T A L RE S O U R C E S
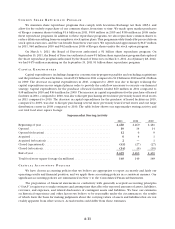
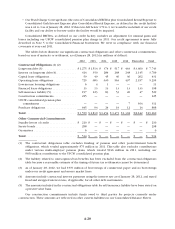
Cash Flow Information
Net cash provided by operating activities
We generated $2.7 billion of cash from operations in 2011, compared to $3.4 billion in 2010 and $2.9
billion in 2009. The cash provided by operating activities came from net earnings including noncontrolling
interests adjusted primarily for non-cash expenses of depreciation and amortization, the LIFO charge, the
goodwill impairment charge, and changes in working capital. The decrease in net cash provided by operating
activities in 2011, compared to 2010, was primarily due to the decline in net earnings including noncontrolling
interests due to the UFCW consolidated pension plan charge. Changes in working capital also provided (used)
cash from operating activities of ($300) million in 2011, compared to $698 million in 2010 and ($83) million in
2009. The decrease in cash provided by changes in working capital for 2011, compared to 2010, was primarily
due to an increase in inventories, offset partially by increases in trade accounts payable and accrued expenses.
In addition, the decrease in net cash provided by operating activities in 2011, compared to 2010, was partially
offset by an increase in other long-term liabilities for our remaining estimated commitment for the UAAL in
excess of the cash contribution. The change in working capital for 2010, compared to 2009, was primarily due
to increases in trade accounts payable and accrued expenses and a decrease in prepaid expenses. In addition,
the increase in net cash provided by operating activities in 2010, compared to 2009, was partially offset by a
decrease in other long-term liabilities. Prepaid expenses decreased in 2010, compared to 2009, due to Kroger
not prefunding $300 million of employee benefits in 2010. These amounts are also net of cash contributions
to our Company-sponsored defined benefit pension plans totaling $52 million in 2011, $141 million in 2010,
and $265 million in 2009.
The amount of cash paid for income taxes decreased in 2011, compared to 2010, primarily due to the
decrease in net earnings including noncontrolling interests and from the bonus depreciation deductions
allowed by the 2010 Tax Relief Act for property placed into service in 2011. The amount of cash paid for
income taxes increased in 2010, compared to 2009, due to reversals of temporary differences in 2010 and
overpayments being applied to 2009 income taxes.
Net cash used by investing activities
Cash used by investing activities was $1.9 billion in 2011, compared to $2.0 billion in 2010 and $2.3 billion in
2009. The amount of cash used by investing activities decreased in 2011, compared to 2010, due to decreased
payments for other investing activities, offset partially by increased payments for acquisitions. The amount of
cash used by investing activities decreased in 2010, compared to 2009, due primarily to decreased payments
on capital expenditures. Capital expenditures, including changes in construction-in-progress payables and
excluding acquisitions, were $1.9 billion in 2011, $1.9 billion in 2010, and $2.3 billion in 2009. Refer to the
Capital Expenditures section for an overview of our supermarket storing activity during the last three years.
Net cash used by financing activities
Financing activities used $1.4 billion of cash in 2011, compared to $1.0 billion in 2010 and $434 million
in 2009. The increase in the amount of cash used for financing activities in 2011, compared to 2010, was
primarily related to the increased payments for treasury stock purchases, partially offset by increased
borrowings under our commercial paper program. The increase in the amount of cash used for financing
activities in 2010, compared to 2009, was primarily related to the increased payments on long-term debt and
treasury stock repurchases, decreased proceeds from the issuance of long-term debt, and an investment in the
remaining interest of a variable interest entity, partially offset by decreased payments on the credit facility. We
repurchased $1.5 billion of Kroger common shares in 2011, compared to $545 million in 2010 and $218 million
in 2009. We paid dividends totaling $257 million in 2011, $250 million in 2010 and $238 million in 2009.
Debt Management
Total debt, including both the current and long-term portions of capital leases and lease-financing
obligations, increased $273 million to $8.2 billion as of year-end 2011, compared to year-end 2010. The increase
in 2011, compared to 2010, resulted from increased net borrowings of commercial paper of $370 million and