Kroger 2011 Annual Report Download - page 101
Download and view the complete annual report
Please find page 101 of the 2011 Kroger annual report below. You can navigate through the pages in the report by either clicking on the pages listed below, or by using the keyword search tool below to find specific information within the annual report.-
 1
1 -
2
-
3
-
4
-
5
-
6
-
7
-
8
-
9
-
10
-
11
-
12
-
13
-
14
-
15
-
16
-
17
-
18
-
19
-
20
-
21
-
22
-
23
-
24
-
25
-
26
-
27
-
28
-
29
-
30
-
31
-
32
-
33
-
34
-
35
-
36
-
37
-
38
-
39
-
40
-
41
-
42
-
43
-
44
-
45
-
46
-
47
-
48
-
49
-
50
-
51
-
52
-
53
-
54
-
55
-
56
-
57
-
58
-
59
-
60
-
61
-
62
-
63
-
64
-
65
-
66
-
67
-
68
-
69
-
70
-
71
-
72
-
73
-
74
-
75
-
76
-
77
-
78
-
79
-
80
-
81
-
82
-
83
-
84
-
85
-
86
-
87
-
88
-
89
-
90
-
 91
91 -
 92
92 -
 93
93 -
 94
94 -
 95
95 -
 96
96 -
 97
97 -
 98
98 -
 99
99 -
 100
100 -
 101
101 -
 102
102 -
 103
103 -
 104
104 -
 105
105 -
 106
106 -
 107
107 -
 108
108 -
 109
109 -
 110
110 -
 111
111 -
112
-
113
-
114
-
115
-
116
-
117
-
118
-
119
-
120
-
121
-
122
-
123
-
124
 |
 |

A-46
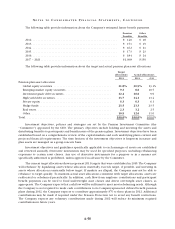
NO T E S T O CO N S O L I D A T E D FI N A N C I A L ST A T E M E N T S , CO N T I N U E D
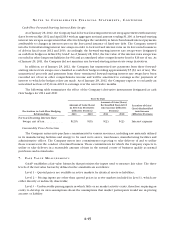
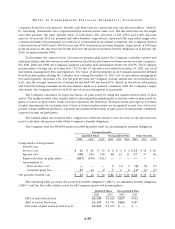
For items carried at (or adjusted to) fair value in the consolidated financial statements, the following
tables summarize the fair value of these instruments at January 28, 2012 and January 29, 2011:
January 28, 2012 Fair Value Measurements Using
Quoted Prices in
Active Markets
for Identical
Assets
(Level 1)
Significant Other
Observable Inputs
(Level 2)
Significant
Unobservable
Inputs
(Level 3) Total
Available-for-Sale Securities . . . . . . . . . . . . . . $ 8 $ — $20 $ 28
Long-Lived Assets . . . . . . . . . . . . . . . . . . . . . . — — 23 23
Interest Rate Hedges .................... — (16) — (16)
Total. . . . . . . . . . . . . . . . . . . . . . . . . . . . . . . . . $ 8 $ (16) $43 $ 35
January 29, 2011 Fair Value Measurements Using
Quoted Prices in
Active Markets
for Identical
Assets
(Level 1)
Significant Other
Observable Inputs
(Level 2)
Significant
Unobservable
Inputs
(Level 3) Total
Available-for-Sale Securities . . . . . . . . . . . . . . $10 $ — $17 $27
Long-Lived Assets . . . . . . . . . . . . . . . . . . . . . . — — 12 12
Interest Rate Hedges .................... — 45 — 45
Total. . . . . . . . . . . . . . . . . . . . . . . . . . . . . . . . . $10 $45 $29 $84
The Company values interest rate hedges using observable forward yield curves. These forward yield
curves are classified as Level 2 inputs.
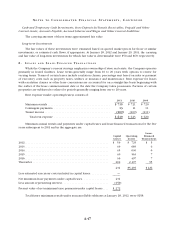
Fair value measurements of non-financial assets and non-financial liabilities are primarily used in the
impairment analysis of goodwill, other intangible assets, and long-lived assets, and in the valuation of store
lease exit costs. The Company reviews goodwill and other intangible assets for impairment annually, during
the fourth quarter of each fiscal year, and as circumstances indicate the possibility of impairment. See Note 2
for further discussion related to the Company’s carrying value of goodwill and its goodwill impairment charge
in 2009. Long-lived assets and store lease exit costs were measured at fair value on a nonrecurring basis
using Level 3 inputs as defined in the fair value hierarchy. See Note 1 for further discussion of the Company’s
policies and recorded amounts for impairments of long-lived assets and valuation of store lease exit costs. In
2011, long-lived assets with a carrying amount of $60 were written down to their fair value of $23, resulting
in an impairment charge of $37. In 2010, long-lived assets with a carrying amount of $37 were written down
to their fair value of $12, resulting in an impairment charge of $25.
In 2011, the Company recorded unrealized gains on its level 3 Available-for-Sale Securities in the amount
of $3. In 2010, the Company recorded unrealized gains on its level 3 Available-for-Sale Securities in the amount
of $9.
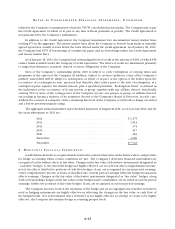
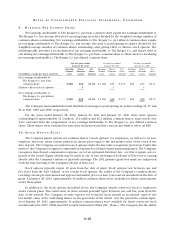
FA I R VA L U E O F OT H E R FI N A N C I A L IN S T R U M E N T S
Current and Long-term Debt
The fair value of the Company’s long-term debt, including current maturities, was estimated based on the
quoted market prices for the same or similar issues adjusted for illiquidity based on available market evidence.
If quoted market prices were not available, the fair value was based upon the net present value of the future
cash flow using the forward interest rate yield curve in effect at respective year-ends. At January 28, 2012, the
fair value of total debt was $8,700 compared to a carrying value of $7,743. At January 29, 2011, the fair value
of total debt was $8,191 compared to a carrying value of $7,434.