Kodak 2003 Annual Report Download - page 79
Download and view the complete annual report
Please find page 79 of the 2003 Kodak annual report below. You can navigate through the pages in the report by either clicking on the pages listed below, or by using the keyword search tool below to find specific information within the annual report.-
 1
1 -
2
-
3
-
4
-
5
-
6
-
7
-
8
-
9
-
10
-
11
-
12
-
13
-
14
-
15
-
16
-
17
-
18
-
19
-
20
-
21
-
22
-
23
-
24
-
25
-
26
-
27
-
28
-
29
-
30
-
31
-
32
-
33
-
34
-
35
-
36
-
37
-
38
-
39
-
40
-
41
-
42
-
43
-
44
-
45
-
46
-
47
-
48
-
49
-
50
-
51
-
52
-
53
-
54
-
55
-
56
-
57
-
58
-
59
-
60
-
61
-
62
-
63
-
64
-
65
-
66
-
67
-
68
-
 69
69 -
 70
70 -
 71
71 -
 72
72 -
 73
73 -
 74
74 -
 75
75 -
 76
76 -
 77
77 -
 78
78 -
 79
79 -
 80
80 -
 81
81 -
 82
82 -
 83
83 -
 84
84 -
 85
85 -
 86
86 -
 87
87 -
 88
88 -
 89
89 -
90
-
91
-
92
-
93
-
94
-
95
-
96
-
97
-
98
-
99
-
100
-
101
-
102
-
103
-
104
-
105
-
106
-
107
-
108
-
109
-
110
-
111
-
112
-
113
-
114
-
115
-
116
-
117
-
118
-
119
-
120
-
121
-
122
-
123
-
124
-
125
-
126
-
127
-
128
-
129
-
130
-
131
-
132
-
133
-
134
-
135
-
136
-
137
-
138
-
139
-
140
-
141
-
142
-
143
-
144
 |
 |

Financials
79
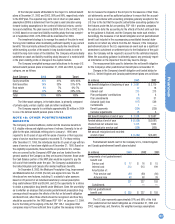
Eastman Kodak Company
Summary of Operating Data
(in millions, except per share data, shareholders and employees)
2003 2002 2001 2000 1999
Net sales from continuing operations $ 13,317 $ 12,835 $ 13,229 $ 13,994 $ 14,089
Earnings from continuing operations
before interest, other charges, net,
and income taxes 371 1,220 352 2,214 1,990
Earnings (loss) from
Continuing operations 238(1) 793(2) 81(3) 1,407(4) 1,392(5)
Discontinued operations 27(6) (23)(6) (5)(6) ——
Net earnings 265 770 76 1,407 1,392
Earnings and Dividends
Net earnings
–% of sales 2.0% 6.0% 0.6% 10.1% 9.9%
–% return on average shareholders’ equity 8.8% 27.2% 2.4% 38.3% 35.2%
Basic earnings (loss) per share
Continuing operations .83 2.72 .28 4.62 4.38
Discontinued operations .09 (.08) (.02) — —
Total .92 2.64 .26 4.62 4.38
Diluted earnings (loss) per share
Continuing operations .83 2.72 .28 4.59 4.33
Discontinued operations .09 (.08) (.02) — —
Total .92 2.64 .26 4.59 4.33
Cash dividends declared and paid
–on common shares 330 525 643 545 563
–per common share 1.15 1.80 2.21 1.76 1.76
Common shares outstanding at year end 286.6 285.9 290.9 290.5 310.4
Shareholders at year end 85,712 89,988 91,893 113,308 131,719
Statement of Financial Position Data
Operational working capital(7) $ 1,094 $ 474 $ 797 $ 1,420 $ 777
Working capital 148 (968) (737) (786) (385)
Property, plant and equipment, net 5,094 5,420 5,659 5,919 5,947
Total assets 14,818 13,494 13,362 14,212 14,370
Short-term borrowings and current
portion of long-term debt 946 1,442 1,534 2,206 1,163
Long-term debt, net of
current portion 2,302 1,164 1,666 1,166 936
Total shareholders’ equity 3,264 2,777 2,894 3,428 3,912
Supplemental Information
Net sales from continuing operations
–Photography $ 9,232 $ 9,002 $ 9,403 $ 10,231 $ 10,265
–Health Imaging 2,431 2,274 2,262 2,220 2,159
–Commercial Imaging 1,559 1,456 1,454 1,417 1,479
–All Other 95 103 110 126 186
Research and development costs 781 762 779 784 817
Depreciation 830 818 765 738 773
Taxes (excludes payroll, sales and excise taxes) 24 288 154 933 806
Wages, salaries and employee benefits 4,090 3,991 3,824 3,726 3,962
Employees at year end
–in the U.S. 35,400 39,000 42,000 43,200 43,300
–worldwide 63,900 70,000 75,100 78,400 80,650
See footnotes on next page.