Kodak 2003 Annual Report Download - page 22
Download and view the complete annual report
Please find page 22 of the 2003 Kodak annual report below. You can navigate through the pages in the report by either clicking on the pages listed below, or by using the keyword search tool below to find specific information within the annual report.-
 1
1 -
2
-
3
-
4
-
5
-
6
-
7
-
8
-
9
-
10
-
11
-
 12
12 -
 13
13 -
 14
14 -
 15
15 -
 16
16 -
 17
17 -
 18
18 -
 19
19 -
 20
20 -
 21
21 -
 22
22 -
 23
23 -
 24
24 -
 25
25 -
 26
26 -
 27
27 -
 28
28 -
 29
29 -
 30
30 -
 31
31 -
 32
32 -
33
-
34
-
35
-
36
-
37
-
38
-
39
-
40
-
41
-
42
-
43
-
44
-
45
-
46
-
47
-
48
-
49
-
50
-
51
-
52
-
53
-
54
-
55
-
56
-
57
-
58
-
59
-
60
-
61
-
62
-
63
-
64
-
65
-
66
-
67
-
68
-
69
-
70
-
71
-
72
-
73
-
74
-
75
-
76
-
77
-
78
-
79
-
80
-
81
-
82
-
83
-
84
-
85
-
86
-
87
-
88
-
89
-
90
-
91
-
92
-
93
-
94
-
95
-
96
-
97
-
98
-
99
-
100
-
101
-
102
-
103
-
104
-
105
-
106
-
107
-
108
-
109
-
110
-
111
-
112
-
113
-
114
-
115
-
116
-
117
-
118
-
119
-
120
-
121
-
122
-
123
-
124
-
125
-
126
-
127
-
128
-
129
-
130
-
131
-
132
-
133
-
134
-
135
-
136
-
137
-
138
-
139
-
140
-
141
-
142
-
143
-
144
 |
 |

Financials
22
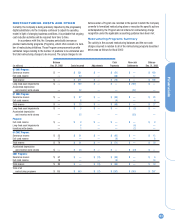
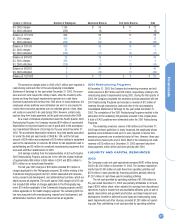
SUMMARY
(in millions, except per share data) 2003 Change 2002 Change 2001
Net sales from continuing operations $ 13,317 + 4% $ 12,835 - 3% $ 13,229
Earnings from continuing operations before interest,
other charges, net, and income taxes 371 - 70 1,220 +247 352
Earnings from continuing operations 238 - 70 793 +879 81
Earnings (loss) from discontinued operations 27 +217 (23) -360 (5)
Net earnings 265 - 66 770 +913 76
Basic and diluted earnings (loss) per share:
Continuing operations .83 - 69 2.72 +871 .28
Discontinued operations .09 +213 (.08) -300 (.02)
Total .92 - 65 2.64 +915 .26
The Company’s results as noted above include certain one-time
items, such as charges associated with focused cost reductions and other
special charges. These one-time items, which are described below, should
be considered to better understand the Company’s results of operations
that were generated from normal operational activities.
2003
The Company’s results from continuing operations for the year included
the following:
Charges of $557 million ($378 million after tax) related to focused
cost reductions implemented in the first and third quarters. See further
discussion in the Restructuring Costs and Other section of Management’s
Discussion and Analysis of Financial Condition and Results of Operations
(MD&A) and Note 16, “Restructuring Costs and Other.”
Charges of $16 million ($10 million after tax) related to venture
investment impairments and other asset write-offs incurred in the second
and fourth quarters. See MD&A and Note 7, “Investments,” for further dis-
cussion of venture investment impairments.
Charges of $31 million ($19 million after tax), including $21 million
($13 million after tax) in the first quarter and $10 million ($6 million after
tax) in the fourth quarter, related to purchased in-process R&D.
Charges of $14 million ($9 million after tax) connected with the set-
tlement of a patent infringement claim.
Charges of $12 million ($7 million after tax) related to an intellectual
property settlement.
Charges of $14 million ($9 million after tax) connected with the set-
tlement of certain issues relating to a prior-year acquisition.
Charges of $8 million ($5 million after tax) for a donation to a tech-
nology enterprise.
Charges of $8 million ($5 million after tax) for legal settlements.
Reversal of $9 million ($6 million after tax) for an environmental
reserve.
Income tax benefits of $13 million, which included tax benefits relat-
ed to the donation of patents in the first and fourth quarters, amounting to
$8 million and $5 million, respectively.
2002
The Company’s results from continuing operations for the year included
the following:
Charges of $114 million ($80 million after tax) related to focused
cost reductions implemented in the third and fourth quarters. See further
discussion in the Restructuring Costs and Other section of MD&A and Note
16, “Restructuring Costs and Other.”
Charges of $50 million ($34 million after tax) related to venture
investment impairments and other asset write-offs incurred in the second,
third and fourth quarters. See MD&A and Note 7, “Investments,” for further
discussion of venture investment impairments.
Income tax benefits of $121 million, including a $45 million tax ben-
efit related to the closure of the PictureVision subsidiary in the second
quarter, a $46 million benefit from the loss realized on the liquidation of a
Japanese photofinishing operations subsidiary in the third quarter, an $8
million benefit from a fourth quarter property donation, and a $22 million
benefit relating to the decline in the year-over-year operational effective
tax rate.
2001
The Company’s results from continuing operations for the year included
the following one-time items:
Charges of $830 million ($583 million after tax) related to the
restructuring programs implemented in the second, third and fourth quar-
ters and other asset impairments.
A charge of $41 million ($28 million after tax) for environmental
exposures.
A charge of $20 million ($14 million after tax) for the Kmart bank-
ruptcy.
Income tax benefits of $31 million, including a favorable tax settle-
ment of $11 million and a $20 million benefit relating to the decline in the
year-over-year operational effective tax rate.