Kodak 2003 Annual Report Download - page 69
Download and view the complete annual report
Please find page 69 of the 2003 Kodak annual report below. You can navigate through the pages in the report by either clicking on the pages listed below, or by using the keyword search tool below to find specific information within the annual report.
Financials
69
Of the total plan assets attributable to the major U.S. defined benefit
plans at December 31, 2003 and 2002, 98% and 99%, respectively, relate
to the KRIP plan. The expected long-term rate of return on plan assets
assumption (EROA) is determined from the plan’s asset allocation using
forward-looking assumptions in the context of historical returns, correla-
tions and volatilities. The plan lowered its EROA from 9.5% in 2002 to 9%
in 2003 based on an asset and liability modeling study that was complet-
ed in September 2002. A 9% EROA will be maintained for 2004.
The investment strategy is to manage the assets of the plan to meet
the long-term liabilities while maintaining sufficient liquidity to pay current
benefits. This is primarily achieved by holding equity-like investments
while investing a portion of the assets in long duration bonds in order to
match the long-term nature of the liabilities. The Company will periodically
undertake an asset and liability modeling study because of a material shift
in the plan’s liability profile or changes in the capital markets.
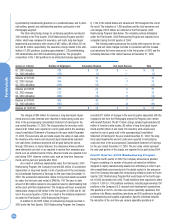
The Company’s weighted-average asset allocations for its major U.S.
defined benefit pension plans at December 31, 2003 and 2002, by asset
category, are as follows:
Asset Category 2003 2002 Target
Equity securities 43% 41% 40%-46%
Debt securities 34% 33% 31%-37%
Real estate 6% 7% 6%-7%
Other 17% 19% 23%-10%
Total 100% 100% 100%
The Other asset category, in the table above, is primarily composed
of private equity, venture capital, cash and other investments.
The Company expects to contribute approximately $5 million in 2004
to one of its defined benefit pension plans in the U.S.
NOTE 18: OTHER POSTRETIREMENT
BENEFITS
The Company provides healthcare, dental and life insurance benefits to
U.S. eligible retirees and eligible survivors of retirees. Generally, to be eli-
gible for the plan, individuals retiring prior to January 1, 1996 were
required to be 55 years of age with ten years of service or their age plus
years of service must have equaled or exceeded 75. For those retiring
after December 31, 1995, the individuals must be 55 years of age with ten
years of service or have been eligible as of December 31, 1995. Based on
the eligibility requirements, these benefits are provided to U.S. retirees
who are covered by the Company’s KRIP plan and are funded from the
general assets of the Company as they are incurred. However, those under
the Cash Balance portion of the KRIP plan would be required to pay the
full cost of their benefits under the plan. The Company’s subsidiaries in
the United Kingdom and Canada offer similar healthcare benefits.
On December 8, 2003, the Medicare Prescription Drug, Improvement
and Modernization Act of 2003 (the Act) was signed into law. The Act
introduces two new features, including (1) a subsidy to plan sponsors
based on 28 percent of an individual beneficiary’s annual prescription
drug costs between $250 and $5,000, and (2) the opportunity for a retiree
to obtain a prescription drug benefit under Medicare. Given the uncertainty
as to whether an employer that provides postretirement prescription drug
coverage should recognize the effects of the Act on its benefit obligation
and benefit cost, when those effects should be recognized, and how they
should be accounted for, the FASB issued FSP 106-1 on January 12, 2004.
Due to the timing of the signing of the Act, FSP 106-1 recognized that
companies may not have sufficient time to gather the necessary informa-
tion to measure the impacts of the Act prior to the issuance of their finan-
cial statements, as well as sufficient guidance to ensure that the account-
ing is in accordance with accounting principles generally accepted in the
U.S. Due to the fact that the specific authoritative accounting guidance for
the features under the Act are pending, FSP 106-1 provides companies
the option to defer the accounting for the effects of the Act until such time
as the guidance is finalized, and the Company has made such election.
Accordingly, the measures of net benefit obligation and net postretirement
benefit cost included in the accompanying consolidated financial state-
ments do not reflect any effects from the Act. However, if the Company’s
postretirement plan in the U.S. experiences an event such as a significant
amendment, curtailment or settlement prior to the finalization of the guid-
ance, the Company will be required to account for the estimated impacts.
When the accounting guidance is ultimately issued, any previously report-
ed information on the impacts of the Act may need to change.
The measurement date used to determine the net benefit obligation
for the Company’s other postretirement benefit plans is December 31.
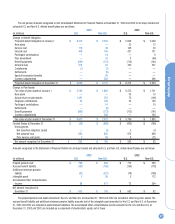
Changes in the Company’s benefit obligation and funded status for
the U.S., United Kingdom and Canada postretirement plans are as follows:
(in millions) 2003 2002
Net benefit obligation at beginning of year $ 3,687 $ 3,110
Service cost 17 16
Interest cost 213 213
Plan participants’ contributions 64
Plan amendments (30) 31
Actuarial (gain) loss (117) 549
Curtailments 1—
Benefit payments (254) (239)
Currency adjustments 15 3
Net benefit obligation at end of year $ 3,538 $ 3,687
Funded status at end of year $ (3,538) $(3,687)
Unamortized net actuarial loss 1,415 1,600
Unamortized prior service cost (326) (360)
Net amount recognized and recorded
at end of year $ (2,449) $(2,447)
Postretirement benefit cost for the Company’s U.S., United Kingdom
and Canada postretirement benefit plans included:
(in millions) 2003 2002 2001
Components of net postretirement
benefit cost
Service cost $ 17 $ 16 $ 15
Interest cost 213 213 199
Amortization of:
Prior service cost (61) (60) (60)
Actuarial loss 68 58 39
237 227 193
Curtailments 1——
Total net postretirement
benefit cost $ 238 $ 227 $ 193
The U.S. plan represents approximately 97% and 98% of the total
other postretirement net benefit obligation as of December 31, 2003 and
2002, respectively, and, therefore, the weighted-average assumptions


