Kodak 2003 Annual Report Download - page 11
Download and view the complete annual report
Please find page 11 of the 2003 Kodak annual report below. You can navigate through the pages in the report by either clicking on the pages listed below, or by using the keyword search tool below to find specific information within the annual report.-
 1
1 -
 2
2 -
 3
3 -
 4
4 -
 5
5 -
 6
6 -
 7
7 -
 8
8 -
 9
9 -
 10
10 -
 11
11 -
 12
12 -
 13
13 -
 14
14 -
 15
15 -
 16
16 -
 17
17 -
 18
18 -
 19
19 -
 20
20 -
 21
21 -
 22
22 -
23
-
24
-
25
-
26
-
27
-
28
-
29
-
30
-
31
-
32
-
33
-
34
-
35
-
36
-
37
-
38
-
39
-
40
-
41
-
42
-
43
-
44
-
45
-
46
-
47
-
48
-
49
-
50
-
51
-
52
-
53
-
54
-
55
-
56
-
57
-
58
-
59
-
60
-
61
-
62
-
63
-
64
-
65
-
66
-
67
-
68
-
69
-
70
-
71
-
72
-
73
-
74
-
75
-
76
-
77
-
78
-
79
-
80
-
81
-
82
-
83
-
84
-
85
-
86
-
87
-
88
-
89
-
90
-
91
-
92
-
93
-
94
-
95
-
96
-
97
-
98
-
99
-
100
-
101
-
102
-
103
-
104
-
105
-
106
-
107
-
108
-
109
-
110
-
111
-
112
-
113
-
114
-
115
-
116
-
117
-
118
-
119
-
120
-
121
-
122
-
123
-
124
-
125
-
126
-
127
-
128
-
129
-
130
-
131
-
132
-
133
-
134
-
135
-
136
-
137
-
138
-
139
-
140
-
141
-
142
-
143
-
144
 |
 |

Financials
11
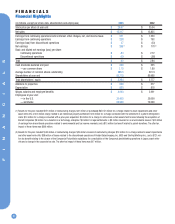
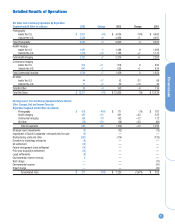
Detailed Results of Operations
Net Sales from Continuing Operations by Reportable
Segment and All Other (in millions) 2003 Change 2002 Change 2001
Photography
Inside the U.S. $ 3,812 -6% $ 4,034 -10% $ 4,482
Outside the U.S. 5,420 +9 4,968 +1 4,921
Total Photography 9,232 +3 9,002 -4 9,403
Health Imaging
Inside the U.S. 1,061 -2 1,088 0 1,089
Outside the U.S. 1,370 +16 1,186 +1 1,173
Total Health Imaging 2,431 +7 2,274 +1 2,262
Commercial Imaging
Inside the U.S. 912 +11 818 0 820
Outside the U.S. 647 +1 638 +1 634
Total Commercial Imaging 1,559 +7 1,456 0 1,454
All Other
Inside the U.S. 44 -17 53 -22 68
Outside the U.S. 51 +2 50 +19 42
Total All Other 95 -8 103 -6 110
Total Net Sales $ 13,317 +4% $ 12,835 -3% $ 13,229
Earnings (Loss) from Continuing Operations Before Interest,
Other Charges, Net, and Income Taxes by
Reportable Segment and All Other (in millions)
Photography $ 418 - 46% $ 771 -2% $ 787
Health Imaging 481 +12 431 +33 323
Commercial Imaging 166 -14 192 +12 172
All Other (78) -179 (28) +53 (60)
Total of segments 987 -28 1,366 +12 1,222
Strategic asset impairments (3) (32) (12)
Impairment of Burrell Companies’ net assets held for sale (9) ——
Restructuring costs and other (557) (114) (720)
Donation to technology enterprise (8) ——
GE settlement (12) ——
Patent infringement claim settlement (14) ——
Prior year acquisition settlement (14) ——
Legal settlements (8) ——
Environmental reserve reversal 9——
Wolf charge ——(77)
Environmental reserve ——(41)
Kmart charge ——(20)
Consolidated total $ 371 - 70% $ 1,220 +247% $ 352