Honeywell 2007 Annual Report Download - page 99
Download and view the complete annual report
Please find page 99 of the 2007 Honeywell annual report below. You can navigate through the pages in the report by either clicking on the pages listed below, or by using the keyword search tool below to find specific information within the annual report.-
 1
1 -
2
-
3
-
4
-
5
-
6
-
7
-
8
-
9
-
10
-
11
-
12
-
13
-
14
-
15
-
16
-
17
-
18
-
19
-
20
-
21
-
22
-
23
-
24
-
25
-
26
-
27
-
28
-
29
-
30
-
31
-
32
-
33
-
34
-
35
-
36
-
37
-
38
-
39
-
40
-
41
-
42
-
43
-
44
-
45
-
46
-
47
-
48
-
49
-
50
-
51
-
52
-
53
-
54
-
55
-
56
-
57
-
58
-
59
-
60
-
61
-
62
-
63
-
64
-
65
-
66
-
67
-
68
-
69
-
70
-
71
-
72
-
73
-
74
-
75
-
76
-
77
-
78
-
79
-
80
-
81
-
82
-
83
-
84
-
85
-
86
-
87
-
88
-
 89
89 -
 90
90 -
 91
91 -
 92
92 -
 93
93 -
 94
94 -
 95
95 -
 96
96 -
 97
97 -
 98
98 -
 99
99 -
 100
100 -
 101
101 -
 102
102 -
 103
103 -
 104
104 -
 105
105 -
 106
106 -
 107
107 -
 108
108 -
 109
109 -
110
-
111
-
112
-
113
-
114
-
115
-
116
-
117
-
118
-
119
-
120
-
121
-
122
-
123
-
124
-
125
-
126
-
127
-
128
-
129
-
130
-
131
-
132
-
133
-
134
-
135
-
136
-
137
-
138
-
139
-
140
-
141
-
142
-
143
-
144
-
145
-
146
-
147
-
148
-
149
-
150
-
151
-
152
-
153
-
154
-
155
-
156
-
157
-
158
-
159
-
160
-
161
-
162
-
163
-
164
-
165
-
166
-
167
-
168
-
169
-
170
-
171
-
172
-
173
-
174
-
175
-
176
-
177
-
178
-
179
-
180
-
181
 |
 |

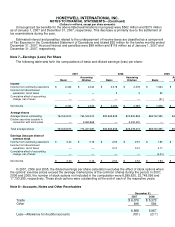
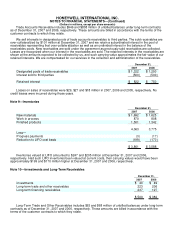
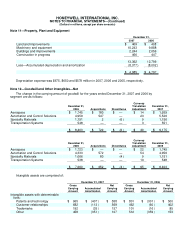
HONEYWELL INTERNATIONAL INC.
NOTES TO FINANCIAL STATEMENTS—(Continued)
(Dollars in millions, except per share amounts)
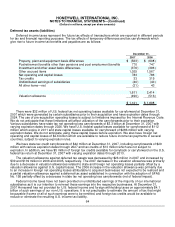
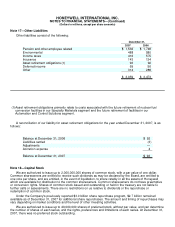
Note 11—Property, Plant and Equipment
December 31,
2007 2006
Land and improvements $ 409 $ 408
Machinery and equipment 10,243 9,888
Buildings and improvements 2,244 2,056
Construction in progress 466 447
13,362 12,799
Less—Accumulated depreciation and amortization (8,377) (8,002)
$ 4,985 $ 4,797
Depreciation expense was $675, $650 and $578 million in 2007, 2006 and 2005, respectively.
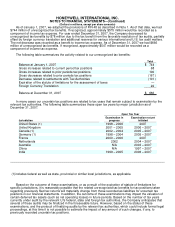
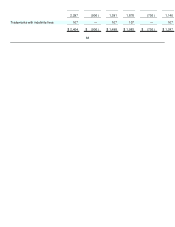
Note 12—Goodwill and Other Intangibles—Net
The change in the carrying amount of goodwill for the years ended December 31, 2007 and 2006 by
segment are as follows:
December 31,
2006 Acquisitions Divestitures
Currency
Translation
Adjustment December 31,
2007
Aerospace $ 1,745 $ 180 $ — $ 14 $ 1,939
Automation and Control Solutions 4,959 547 — 23 5,529
Specialty Materials 1,151 2 (6) 9 1,156
Transportation Systems 548 — — 3 551
$ 8,403 $ 729 $ (6) $ 49 $ 9,175
December 31,
2005 Acquisitions Divestitures
Currency
Translation
Adjustment December 31,
2006
Aerospace $ 1,723 $ — $ — $ 22 $ 1,745
Automation and Control Solutions 4,333 572 — 54 4,959
Specialty Materials 1,066 80 (4) 9 1,151
Transportation Systems 538 — — 10 548
$ 7,660 $ 652 $ (4) $ 95 $ 8,403
Intangible assets are comprised of:
December 31, 2007 December 31, 2006
Gross
Carrying
Amount Accumulated
Amortization
Net
Carrying
Amount
Gross
Carrying
Amount Accumulated
Amortization
Net
Carrying
Amount
Intangible assets with determinable
lives:
Patents and technology $ 965 $ (407) $ 558 $ 801 $ (301) $ 500
Customer relationships 682 (113) 569 462 (60) 402
Trademarks 192 (35) 157 101 (16) 85
Other 458 (351) 107 512 (359) 153