Honeywell 2007 Annual Report Download - page 31
Download and view the complete annual report
Please find page 31 of the 2007 Honeywell annual report below. You can navigate through the pages in the report by either clicking on the pages listed below, or by using the keyword search tool below to find specific information within the annual report.-
 1
1 -
2
-
3
-
4
-
5
-
6
-
7
-
8
-
9
-
10
-
11
-
12
-
13
-
14
-
15
-
16
-
17
-
18
-
19
-
20
-
 21
21 -
 22
22 -
 23
23 -
 24
24 -
 25
25 -
 26
26 -
 27
27 -
 28
28 -
 29
29 -
 30
30 -
 31
31 -
 32
32 -
 33
33 -
 34
34 -
 35
35 -
 36
36 -
 37
37 -
 38
38 -
 39
39 -
 40
40 -
 41
41 -
42
-
43
-
44
-
45
-
46
-
47
-
48
-
49
-
50
-
51
-
52
-
53
-
54
-
55
-
56
-
57
-
58
-
59
-
60
-
61
-
62
-
63
-
64
-
65
-
66
-
67
-
68
-
69
-
70
-
71
-
72
-
73
-
74
-
75
-
76
-
77
-
78
-
79
-
80
-
81
-
82
-
83
-
84
-
85
-
86
-
87
-
88
-
89
-
90
-
91
-
92
-
93
-
94
-
95
-
96
-
97
-
98
-
99
-
100
-
101
-
102
-
103
-
104
-
105
-
106
-
107
-
108
-
109
-
110
-
111
-
112
-
113
-
114
-
115
-
116
-
117
-
118
-
119
-
120
-
121
-
122
-
123
-
124
-
125
-
126
-
127
-
128
-
129
-
130
-
131
-
132
-
133
-
134
-
135
-
136
-
137
-
138
-
139
-
140
-
141
-
142
-
143
-
144
-
145
-
146
-
147
-
148
-
149
-
150
-
151
-
152
-
153
-
154
-
155
-
156
-
157
-
158
-
159
-
160
-
161
-
162
-
163
-
164
-
165
-
166
-
167
-
168
-
169
-
170
-
171
-
172
-
173
-
174
-
175
-
176
-
177
-
178
-
179
-
180
-
181
 |
 |

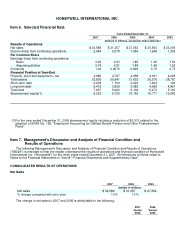
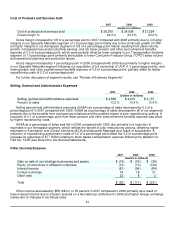
Cost of Products and Services Sold
2007 2006 2005
(Dollars in millions)
Cost of products and services sold $ 26,300 $ 24,096 $ 21,524
Gross margin % 24.0% 23.2% 22.2%
Gross margin increased by 0.8 of a percentage point in 2007 compared with 2006 primarily due to (i) higher
margins in our Specialty Materials segment of 1.0 percentage point mainly due to the continued growth of UOP,
(ii) higher margins in our Aerospace segment of 0.8 of a percentage point mainly resulting from sales volume
growth, increased prices and productivity savings, and (iii) lower pension and other post retirement benefits
expense of 0.3 of a percentage point, which were partially offset by lower margins in our Transportation Systems
segment of 1.0 percentage point primarily attributable to lower Consumer Products Group ("CPG") sales volume
and operational planning and production issues.
Gross margin increased by 1 percentage point in 2006 compared with 2005 due primarily to higher margins
in our Specialty Materials segment following our acquisition of full ownership of UOP (1.3 percentage points), and
lower pension and other postretirement benefits expense of 0.5 of a percentage point, partially offset by higher
repositioning costs of 0.2 of a percentage point.
For further discussion of segment results, see "Review of Business Segments".
Selling, General and Administrative Expenses
2007 2006 2005
(Dollars in millions)
Selling, general and administrative expenses $ 4,565 $ 4,210 $ 3,707
Percent of sales 13.2% 13.4% 13.4%
Selling general and administrative expenses (SG&A) as a percentage of sales decreased by 0.2 of a
percentage point in 2007 compared with 2006. SG&A as a percentage of sales decreased in all of our segments
primarily due to the benefits from cost savings initiatives and the positive impact of prior repositioning actions. A
reduction of 0.1 of a percentage point from lower pension and other post retirement benefits expense was offset
by higher repositioning costs.
SG&A as a percentage of sales was flat in 2006 compared with 2005 due primarily to a reduction in
expenses in our Aerospace segment, which reflects the benefit of prior restructuring actions, offsetting higher
expenses in Automation and Control Solutions (ACS) and Specialty Materials as a result of acquisitions. A
reduction of repositioning and pension costs of 0.2 of a percentage point offset the 0.2 of a percentage point
increase for expenses of $77 million relating to stock-based compensation expense following the adoption of
FAS No. 123R (see Note 20 to the financial statements).
Other (Income)/Expense
2007 2006 2005
(Dollars in millions)
Gain on sale of non-strategic businesses and assets $ (19) $ (30) $ (36)
Equity (income)/loss of affiliated companies (10) (13) (134)
Interest income (81) (94) (84)
Foreign exchange 34 18 21
Other (net) 23 8 2
Total $ (53) $ (111) $ (231)
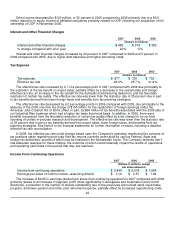
Other income decreased by $58 million, or 52 percent in 2007 compared to 2006 primarily as a result of
lower interest income due to interest received on a favorable tax settlement in 2006 and higher foreign exchange
losses due to changes in exchange rates.
21