Honeywell 2007 Annual Report Download - page 28
Download and view the complete annual report
Please find page 28 of the 2007 Honeywell annual report below. You can navigate through the pages in the report by either clicking on the pages listed below, or by using the keyword search tool below to find specific information within the annual report.-
 1
1 -
2
-
3
-
4
-
5
-
6
-
7
-
8
-
9
-
10
-
11
-
12
-
13
-
14
-
15
-
16
-
17
-
 18
18 -
 19
19 -
 20
20 -
 21
21 -
 22
22 -
 23
23 -
 24
24 -
 25
25 -
 26
26 -
 27
27 -
 28
28 -
 29
29 -
 30
30 -
 31
31 -
 32
32 -
 33
33 -
 34
34 -
 35
35 -
 36
36 -
 37
37 -
 38
38 -
39
-
40
-
41
-
42
-
43
-
44
-
45
-
46
-
47
-
48
-
49
-
50
-
51
-
52
-
53
-
54
-
55
-
56
-
57
-
58
-
59
-
60
-
61
-
62
-
63
-
64
-
65
-
66
-
67
-
68
-
69
-
70
-
71
-
72
-
73
-
74
-
75
-
76
-
77
-
78
-
79
-
80
-
81
-
82
-
83
-
84
-
85
-
86
-
87
-
88
-
89
-
90
-
91
-
92
-
93
-
94
-
95
-
96
-
97
-
98
-
99
-
100
-
101
-
102
-
103
-
104
-
105
-
106
-
107
-
108
-
109
-
110
-
111
-
112
-
113
-
114
-
115
-
116
-
117
-
118
-
119
-
120
-
121
-
122
-
123
-
124
-
125
-
126
-
127
-
128
-
129
-
130
-
131
-
132
-
133
-
134
-
135
-
136
-
137
-
138
-
139
-
140
-
141
-
142
-
143
-
144
-
145
-
146
-
147
-
148
-
149
-
150
-
151
-
152
-
153
-
154
-
155
-
156
-
157
-
158
-
159
-
160
-
161
-
162
-
163
-
164
-
165
-
166
-
167
-
168
-
169
-
170
-
171
-
172
-
173
-
174
-
175
-
176
-
177
-
178
-
179
-
180
-
181
 |
 |
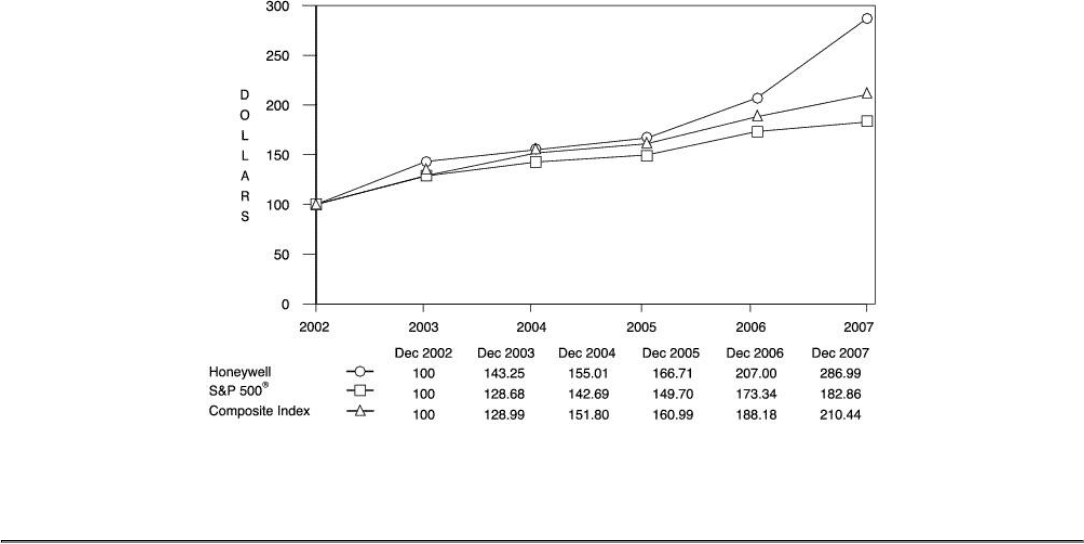
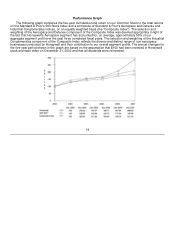
Performance Graph
The following graph compares the five-year cumulative total return on our Common Stock to the total returns
on the Standard & Poor's 500 Stock Index and a composite of Standard & Poor's Aerospace and Defense and
Industrial Conglomerates indices, on an equally weighted basis (the "Composite Index"). The selection and
weighting of the Aerospace and Defense component of the Composite Index was deemed appropriate in light of
the fact that Honeywell's Aerospace segment has accounted for, on average, approximately 50% of our
aggregate segment profit over the past three completed fiscal years. The selection and weighting of the Industrial
Conglomerates component of the Composite Index reflects the diverse and distinct range of non-aerospace
businesses conducted by Honeywell and their contribution to our overall segment profits. The annual changes for
the five-year period shown in the graph are based on the assumption that $100 had been invested in Honeywell
stock and each index on December 31, 2002 and that all dividends were reinvested.
19