Honeywell 2007 Annual Report Download - page 29
Download and view the complete annual report
Please find page 29 of the 2007 Honeywell annual report below. You can navigate through the pages in the report by either clicking on the pages listed below, or by using the keyword search tool below to find specific information within the annual report.-
 1
1 -
2
-
3
-
4
-
5
-
6
-
7
-
8
-
9
-
10
-
11
-
12
-
13
-
14
-
15
-
16
-
17
-
18
-
 19
19 -
 20
20 -
 21
21 -
 22
22 -
 23
23 -
 24
24 -
 25
25 -
 26
26 -
 27
27 -
 28
28 -
 29
29 -
 30
30 -
 31
31 -
 32
32 -
 33
33 -
 34
34 -
 35
35 -
 36
36 -
 37
37 -
 38
38 -
 39
39 -
40
-
41
-
42
-
43
-
44
-
45
-
46
-
47
-
48
-
49
-
50
-
51
-
52
-
53
-
54
-
55
-
56
-
57
-
58
-
59
-
60
-
61
-
62
-
63
-
64
-
65
-
66
-
67
-
68
-
69
-
70
-
71
-
72
-
73
-
74
-
75
-
76
-
77
-
78
-
79
-
80
-
81
-
82
-
83
-
84
-
85
-
86
-
87
-
88
-
89
-
90
-
91
-
92
-
93
-
94
-
95
-
96
-
97
-
98
-
99
-
100
-
101
-
102
-
103
-
104
-
105
-
106
-
107
-
108
-
109
-
110
-
111
-
112
-
113
-
114
-
115
-
116
-
117
-
118
-
119
-
120
-
121
-
122
-
123
-
124
-
125
-
126
-
127
-
128
-
129
-
130
-
131
-
132
-
133
-
134
-
135
-
136
-
137
-
138
-
139
-
140
-
141
-
142
-
143
-
144
-
145
-
146
-
147
-
148
-
149
-
150
-
151
-
152
-
153
-
154
-
155
-
156
-
157
-
158
-
159
-
160
-
161
-
162
-
163
-
164
-
165
-
166
-
167
-
168
-
169
-
170
-
171
-
172
-
173
-
174
-
175
-
176
-
177
-
178
-
179
-
180
-
181
 |
 |

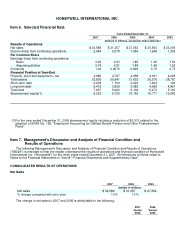
HONEYWELL INTERNATIONAL INC.
Item 6. Selected Financial Data
Years Ended December 31,
2007 2006 2005 2004 2003
(Dollars in millions, except per share amounts)
Results of Operations
Net sales $ 34,589 $ 31,367 $ 27,652 $ 25,593 $ 23,095
Income (loss) from continuing operations 2,444 2,078 1,564 1,246 1,309
Per Common Share
Earnings (loss) from continuing operations:
Basic 3.20 2.53 1.85 1.45 1.52
Assuming dilution 3.16 2.51 1.84 1.45 1.52
Dividends 1.00 0.9075 0.825 0.75 0.75
Financial Position at Year-End
Property, plant and equipment—net 4,985 4,797 4,658 4,331 4,295
Total assets 33,805 30,941 31,633 30,570 28,767
Short-term debt 2,238 1,154 2,024 1,204 199
Long-term debt 5,419 3,909 3,082 4,069 4,961
Total debt 7,657 5,063 5,106 5,273 5,160
Shareowners' equity(1) 9,222 9,720 10,762 10,777 10,289
(1) For the year ended December 31, 2006 shareowners' equity includes a reduction of $1,512 related to the
adoption of SFAS No. 158, "Employers' Accounting for Defined Benefit Pension and Other Postretirement
Plans".
Item 7. Management's Discussion and Analysis of Financial Condition and
Results of Operations
The following Management's Discussion and Analysis of Financial Condition and Results of Operations
("MD&A") is intended to help the reader understand the results of operations and financial condition of Honeywell
International Inc. ("Honeywell") for the three years ended December 31, 2007. All references to Notes relate to
Notes to the Financial Statements in "Item 8—Financial Statements and Supplementary Data".
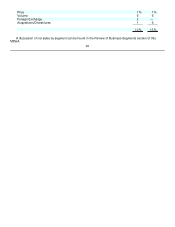
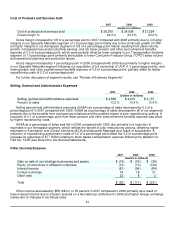
CONSOLIDATED RESULTS OF OPERATIONS
Net Sales
2007 2006 2005
(Dollars in millions)
Net sales $ 34,589 $ 31,367 $ 27,652
% change compared with prior year 10% 13%
The change in net sales in 2007 and 2006 is attributable to the following:
2007
Versus
2006
2006
Versus
2005