Honeywell 2007 Annual Report Download - page 47
Download and view the complete annual report
Please find page 47 of the 2007 Honeywell annual report below. You can navigate through the pages in the report by either clicking on the pages listed below, or by using the keyword search tool below to find specific information within the annual report.-
 1
1 -
2
-
3
-
4
-
5
-
6
-
7
-
8
-
9
-
10
-
11
-
12
-
13
-
14
-
15
-
16
-
17
-
18
-
19
-
20
-
21
-
22
-
23
-
24
-
25
-
26
-
27
-
28
-
29
-
30
-
31
-
32
-
33
-
34
-
35
-
36
-
 37
37 -
 38
38 -
 39
39 -
 40
40 -
 41
41 -
 42
42 -
 43
43 -
 44
44 -
 45
45 -
 46
46 -
 47
47 -
 48
48 -
 49
49 -
 50
50 -
 51
51 -
 52
52 -
 53
53 -
 54
54 -
 55
55 -
 56
56 -
 57
57 -
58
-
59
-
60
-
61
-
62
-
63
-
64
-
65
-
66
-
67
-
68
-
69
-
70
-
71
-
72
-
73
-
74
-
75
-
76
-
77
-
78
-
79
-
80
-
81
-
82
-
83
-
84
-
85
-
86
-
87
-
88
-
89
-
90
-
91
-
92
-
93
-
94
-
95
-
96
-
97
-
98
-
99
-
100
-
101
-
102
-
103
-
104
-
105
-
106
-
107
-
108
-
109
-
110
-
111
-
112
-
113
-
114
-
115
-
116
-
117
-
118
-
119
-
120
-
121
-
122
-
123
-
124
-
125
-
126
-
127
-
128
-
129
-
130
-
131
-
132
-
133
-
134
-
135
-
136
-
137
-
138
-
139
-
140
-
141
-
142
-
143
-
144
-
145
-
146
-
147
-
148
-
149
-
150
-
151
-
152
-
153
-
154
-
155
-
156
-
157
-
158
-
159
-
160
-
161
-
162
-
163
-
164
-
165
-
166
-
167
-
168
-
169
-
170
-
171
-
172
-
173
-
174
-
175
-
176
-
177
-
178
-
179
-
180
-
181
 |
 |

•
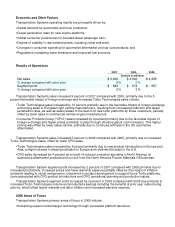
Increasing global penetration and share of diesel and gasoline turbocharger OEM demand;
•
Further global expansion and extension of established strong product brands in CPG; and
•
Addressing CPG operational planning and production issues.
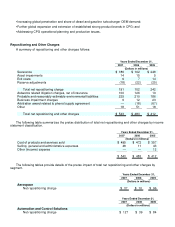
Repositioning and Other Charges
A summary of repositioning and other charges follows:
Years Ended December 31,
2007 2006 2005
(Dollars in millions)
Severance $ 186 $ 102 $ 248
Asset impairments 14 15 5
Exit costs 9 7 14
Reserve adjustments (18) (22) (25)
Total net repositioning charge 191 102 242
Asbestos related litigation charges, net of insurance 100 126 10
Probable and reasonably estimable environmental liabilities 225 210 186
Business impairment charges 9 12 23
Arbitration award related to phenol supply agreement — (18) (67)
Other 18 51 18
Total net repositioning and other charges $ 543 $ 483 $ 412
The following table summarizes the pretax distribution of total net repositioning and other charges by income
statement classification.
Years Ended December 31,
2007 2006 2005
(Dollars in millions)
Cost of products and services sold $ 495 $ 472 $ 357
Selling, general and administrative expenses 48 11 43
Other (income) expense — — 12
$ 543 $ 483 $ 412
The following tables provide details of the pretax impact of total net repositioning and other charges by
segment.
Years Ended December 31,
2007 2006 2005
(Dollars in millions)
Aerospace
Net repositioning charge $ 37 $ 10 $ 96
Years Ended December 31,
2007 2006 2005
(Dollars in millions)
Automation and Control Solutions
Net repositioning charge $ 127 $ 39 $ 84