Honeywell 2007 Annual Report Download - page 138
Download and view the complete annual report
Please find page 138 of the 2007 Honeywell annual report below. You can navigate through the pages in the report by either clicking on the pages listed below, or by using the keyword search tool below to find specific information within the annual report.-
 1
1 -
2
-
3
-
4
-
5
-
6
-
7
-
8
-
9
-
10
-
11
-
12
-
13
-
14
-
15
-
16
-
17
-
18
-
19
-
20
-
21
-
22
-
23
-
24
-
25
-
26
-
27
-
28
-
29
-
30
-
31
-
32
-
33
-
34
-
35
-
36
-
37
-
38
-
39
-
40
-
41
-
42
-
43
-
44
-
45
-
46
-
47
-
48
-
49
-
50
-
51
-
52
-
53
-
54
-
55
-
56
-
57
-
58
-
59
-
60
-
61
-
62
-
63
-
64
-
65
-
66
-
67
-
68
-
69
-
70
-
71
-
72
-
73
-
74
-
75
-
76
-
77
-
78
-
79
-
80
-
81
-
82
-
83
-
84
-
85
-
86
-
87
-
88
-
89
-
90
-
91
-
92
-
93
-
94
-
95
-
96
-
97
-
98
-
99
-
100
-
101
-
102
-
103
-
104
-
105
-
106
-
107
-
108
-
109
-
110
-
111
-
112
-
113
-
114
-
115
-
116
-
117
-
118
-
119
-
120
-
121
-
122
-
123
-
124
-
125
-
126
-
127
-
 128
128 -
 129
129 -
 130
130 -
 131
131 -
 132
132 -
 133
133 -
 134
134 -
 135
135 -
 136
136 -
 137
137 -
 138
138 -
 139
139 -
 140
140 -
 141
141 -
 142
142 -
 143
143 -
 144
144 -
 145
145 -
 146
146 -
 147
147 -
 148
148 -
149
-
150
-
151
-
152
-
153
-
154
-
155
-
156
-
157
-
158
-
159
-
160
-
161
-
162
-
163
-
164
-
165
-
166
-
167
-
168
-
169
-
170
-
171
-
172
-
173
-
174
-
175
-
176
-
177
-
178
-
179
-
180
-
181
 |
 |
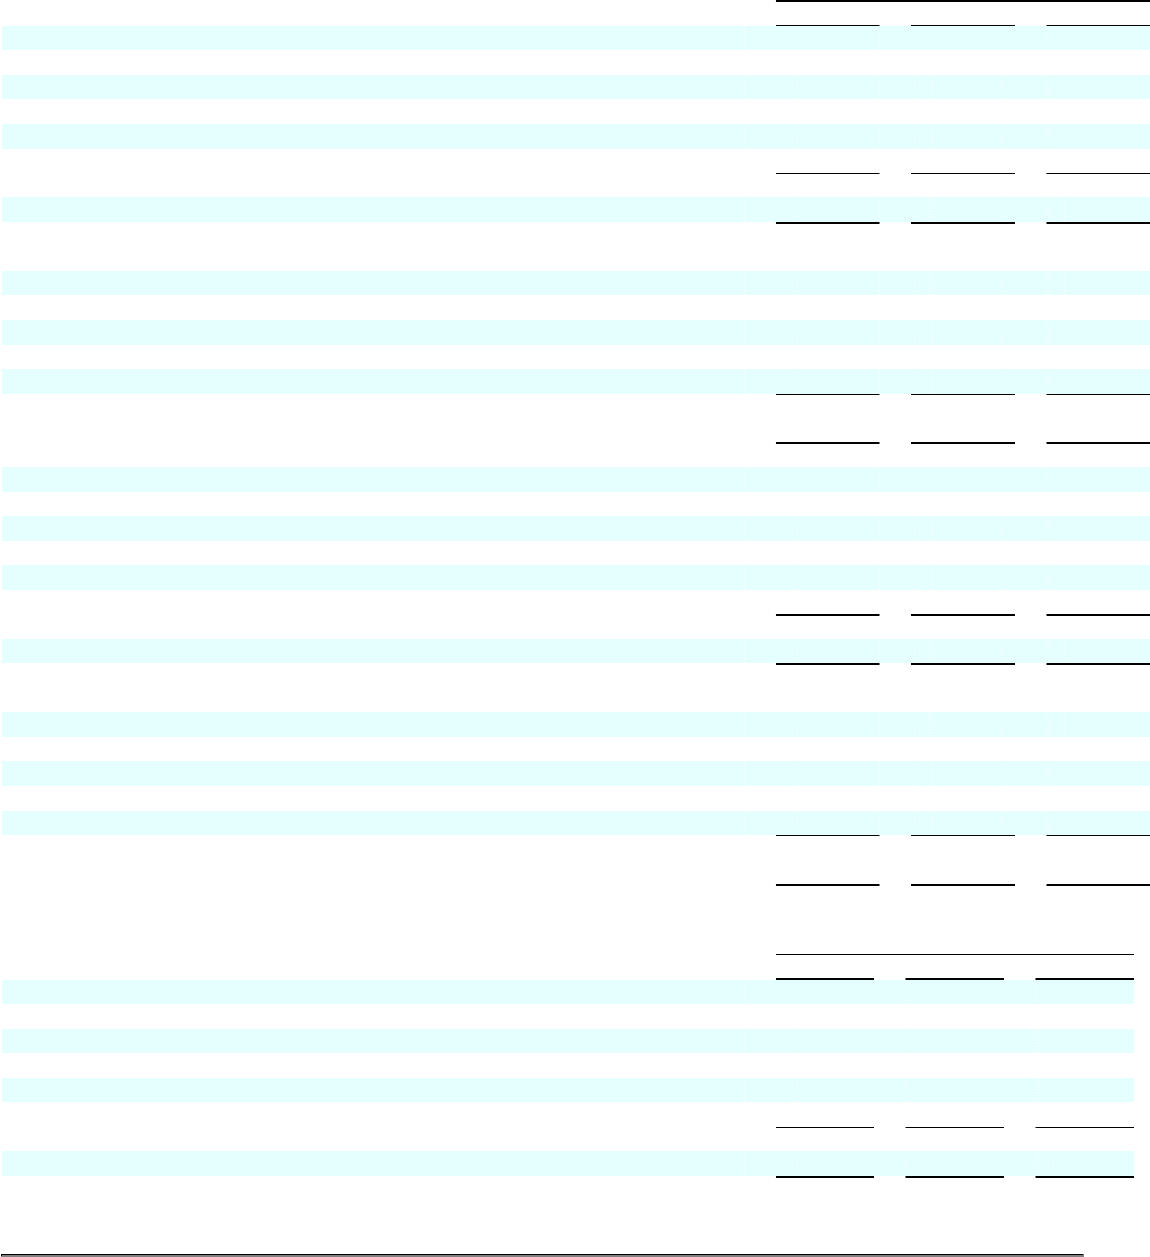
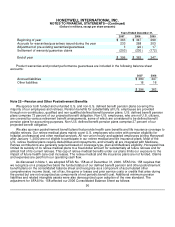
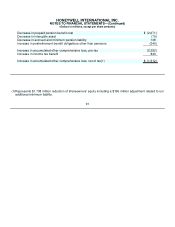
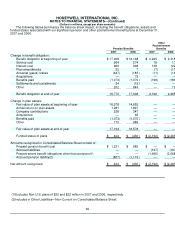
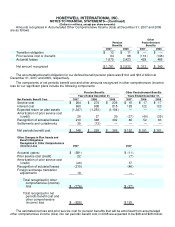
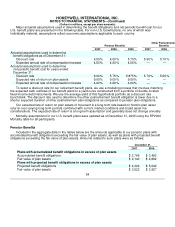
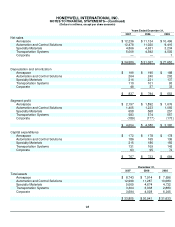
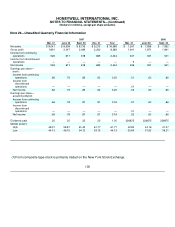
HONEYWELL INTERNATIONAL INC.
NOTES TO FINANCIAL STATEMENTS—(Continued)
(Dollars in millions, except per share amounts)
Years Ended December 31,
2007 2006 2005
Net sales
Aerospace $ 12,236 $ 11,124 $ 10,496
Automation and Control Solutions 12,478 11,020 9,416
Specialty Materials 4,866 4,631 3,234
Transportation Systems 5,009 4,592 4,505
Corporate — — 1
$ 34,589 $ 31,367 $ 27,652
Depreciation and amortization
Aerospace $ 199 $ 195 $ 188
Automation and Control Solutions 264 240 202
Specialty Materials 216 221 137
Transportation Systems 110 101 93
Corporate 48 37 33
$ 837 $ 794 $ 653
Segment profit
Aerospace $ 2,197 $ 1,892 $ 1,676
Automation and Control Solutions 1,405 1,223 1,065
Specialty Materials 658 568 257
Transportation Systems 583 574 557
Corporate (189) (177) (173)
$ 4,654 $ 4,080 $ 3,382
Capital expenditures
Aerospace $ 172 $ 178 $ 178
Automation and Control Solutions 186 165 136
Specialty Materials 215 186 155
Transportation Systems 131 109 143
Corporate 63 95 72
$ 767 $ 733 $ 684
December 31,
2007 2006 2005
Total assets
Aerospace $ 8,743 $ 7,914 $ 7,696
Automation and Control Solutions 12,999 11,287 10,080
Specialty Materials 5,065 4,674 4,732
Transportation Systems 3,304 3,038 2,880
Corporate 3,694 4,028 6,245
$ 33,805 $ 30,941 $ 31,633
98