Honeywell 2007 Annual Report Download - page 65
Download and view the complete annual report
Please find page 65 of the 2007 Honeywell annual report below. You can navigate through the pages in the report by either clicking on the pages listed below, or by using the keyword search tool below to find specific information within the annual report.-
 1
1 -
2
-
3
-
4
-
5
-
6
-
7
-
8
-
9
-
10
-
11
-
12
-
13
-
14
-
15
-
16
-
17
-
18
-
19
-
20
-
21
-
22
-
23
-
24
-
25
-
26
-
27
-
28
-
29
-
30
-
31
-
32
-
33
-
34
-
35
-
36
-
37
-
38
-
39
-
40
-
41
-
42
-
43
-
44
-
45
-
46
-
47
-
48
-
49
-
50
-
51
-
52
-
53
-
54
-
 55
55 -
 56
56 -
 57
57 -
 58
58 -
 59
59 -
 60
60 -
 61
61 -
 62
62 -
 63
63 -
 64
64 -
 65
65 -
 66
66 -
 67
67 -
 68
68 -
 69
69 -
 70
70 -
 71
71 -
 72
72 -
 73
73 -
 74
74 -
 75
75 -
76
-
77
-
78
-
79
-
80
-
81
-
82
-
83
-
84
-
85
-
86
-
87
-
88
-
89
-
90
-
91
-
92
-
93
-
94
-
95
-
96
-
97
-
98
-
99
-
100
-
101
-
102
-
103
-
104
-
105
-
106
-
107
-
108
-
109
-
110
-
111
-
112
-
113
-
114
-
115
-
116
-
117
-
118
-
119
-
120
-
121
-
122
-
123
-
124
-
125
-
126
-
127
-
128
-
129
-
130
-
131
-
132
-
133
-
134
-
135
-
136
-
137
-
138
-
139
-
140
-
141
-
142
-
143
-
144
-
145
-
146
-
147
-
148
-
149
-
150
-
151
-
152
-
153
-
154
-
155
-
156
-
157
-
158
-
159
-
160
-
161
-
162
-
163
-
164
-
165
-
166
-
167
-
168
-
169
-
170
-
171
-
172
-
173
-
174
-
175
-
176
-
177
-
178
-
179
-
180
-
181
 |
 |

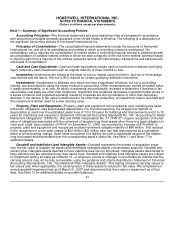
amount of the asset grouping and its fair value. We use the best information available to determine fair value,
which are usually either market prices (if available) or an estimate of the future discounted cash flow. The key
estimates in our discounted cash flow analysis include expected industry growth rates, our assumptions as to
volume, selling prices and costs, and the discount rate selected. As described in more detail in the repositioning
and other charges section of our MD&A, we have recorded impairment charges related to long-lived assets of $9
and $12 million in 2007 and 2006, respectively, principally related to businesses in our Specialty Materials
segment. These businesses were significantly under-performing or were in industries with negative economic
trends and subsequently these businesses were significantly restructured, sold or are in the process of being
sold.
Goodwill Impairment Testing—Goodwill represents the excess of acquisition costs over the fair value of
the net tangible assets and identifiable intangible assets acquired in a business combination. Goodwill is not
amortized, but is subject to impairment testing. Our Goodwill balance, $9.2 billion as of December 31, 2007, is
subject to impairment testing annually as of March 31, or whenever events or changes in circumstances indicate
that the carrying amount may not be fully recoverable, using the guidance and criteria described in Statement of
Financial Accounting Standards No. 142, (SFAS No. 142) "Goodwill and Other Intangible Assets". This testing
compares carrying values to fair values and, when appropriate, the carrying value is reduced to fair value. The
fair value of our reporting units is estimated utilizing a discounted cash flow approach incorporating historic and
projected future operating performance. This impairment test involves the use of accounting estimates and
assumptions, changes in which could materially impact our financial condition or operating performance if actual
results differ from such estimates and assumptions. We completed our annual impairment test as of March 31,
2007 and determined that there was no impairment as of that date.
Income Taxes—Deferred tax assets and liabilities are determined based on the difference between the
financial statements and tax basis of assets and liabilities using enacted tax rates in effect for the year in which
the differences are expected to reverse. Our provision for income taxes is based on domestic and international
statutory income tax rates and tax planning opportunities in the jurisdictions in which we operate. Significant
judgment is required in determining income tax provisions as well as deferred tax asset and liability balances,
including the estimation of valuation allowances and the evaluation of tax positions.
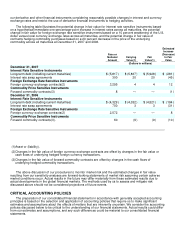
As of December 31, 2007, we recognized a net deferred tax asset of $1,611 million, less a valuation
allowance of $490 million. Net deferred tax assets are primarily comprised of net deductible temporary
differences, net operating loss carryforwards and tax credit carryforwards that are available to reduce taxable
income in future periods. The determination of the amount of valuation allowance to be provided on recorded
deferred tax assets involves estimates regarding (1) the timing and amount of the reversal of taxable temporary
differences, (2) expected future taxable income, and (3) the impact of tax planning strategies. A valuation
allowance is required when it is more likely than not that all or a portion of a deferred tax asset will not be
realized. In assessing the need for a valuation allowance, we consider all available positive and negative
evidence, including past operating results, projections of future taxable income and the feasibility of ongoing tax
planning strategies. The projections of future taxable income include a number of estimates and assumptions
regarding our volume, pricing and costs. Additionally, valuation allowances related to deferred tax assets can be
impacted by changes to tax laws.
Our net deferred tax asset of $1,611 million is comprised of $1,095 million related to U.S. operations and
$516 million related to non-U.S. operations. The U.S. net deferred tax asset of $1,095 million is comprised of net
deductible temporary differences, tax credit carryforwards and state tax net operating losses which we believe
will more likely than not be realized through the generation of future taxable income in the U.S. and tax planning
strategies. We maintain a valuation allowance of $63 million against such asset related to capital losses and
state tax net operating losses. The non-U.S. net deferred tax asset of $516 million is comprised principally of net
operating and capital loss carryforwards, mainly in Germany, France and the United Kingdom. We maintain a
valuation allowance of $427 million against these deferred tax assets reflecting our historical experience and
lower expectations of taxable income over the applicable carryforward periods. As more fully described in Note 6
to the financial statements, our valuation allowance decreased by $26 million in 2007 and increased by $39 and
$139 million in 2006 and 2005, respectively. In the event we determine that we will not be able to realize our net
deferred tax assets in the future, we will reduce such amounts through a charge to income in the period such
44