Honeywell 2007 Annual Report Download - page 140
Download and view the complete annual report
Please find page 140 of the 2007 Honeywell annual report below. You can navigate through the pages in the report by either clicking on the pages listed below, or by using the keyword search tool below to find specific information within the annual report.-
 1
1 -
2
-
3
-
4
-
5
-
6
-
7
-
8
-
9
-
10
-
11
-
12
-
13
-
14
-
15
-
16
-
17
-
18
-
19
-
20
-
21
-
22
-
23
-
24
-
25
-
26
-
27
-
28
-
29
-
30
-
31
-
32
-
33
-
34
-
35
-
36
-
37
-
38
-
39
-
40
-
41
-
42
-
43
-
44
-
45
-
46
-
47
-
48
-
49
-
50
-
51
-
52
-
53
-
54
-
55
-
56
-
57
-
58
-
59
-
60
-
61
-
62
-
63
-
64
-
65
-
66
-
67
-
68
-
69
-
70
-
71
-
72
-
73
-
74
-
75
-
76
-
77
-
78
-
79
-
80
-
81
-
82
-
83
-
84
-
85
-
86
-
87
-
88
-
89
-
90
-
91
-
92
-
93
-
94
-
95
-
96
-
97
-
98
-
99
-
100
-
101
-
102
-
103
-
104
-
105
-
106
-
107
-
108
-
109
-
110
-
111
-
112
-
113
-
114
-
115
-
116
-
117
-
118
-
119
-
120
-
121
-
122
-
123
-
124
-
125
-
126
-
127
-
128
-
129
-
 130
130 -
 131
131 -
 132
132 -
 133
133 -
 134
134 -
 135
135 -
 136
136 -
 137
137 -
 138
138 -
 139
139 -
 140
140 -
 141
141 -
 142
142 -
 143
143 -
 144
144 -
 145
145 -
 146
146 -
 147
147 -
 148
148 -
 149
149 -
 150
150 -
151
-
152
-
153
-
154
-
155
-
156
-
157
-
158
-
159
-
160
-
161
-
162
-
163
-
164
-
165
-
166
-
167
-
168
-
169
-
170
-
171
-
172
-
173
-
174
-
175
-
176
-
177
-
178
-
179
-
180
-
181
 |
 |

HONEYWELL INTERNATIONAL INC.
NOTES TO FINANCIAL STATEMENTS—(Continued)
(Dollars in millions, except per share amounts)
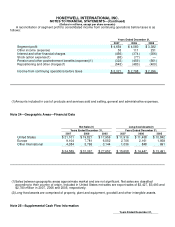
A reconciliation of segment profit to consolidated income from continuing operations before taxes is as
follows:
Years Ended December 31,
2007 2006 2005
Segment profit $ 4,654 $ 4,080 $ 3,382
Other income (expense) 53 111 231
Interest and other financial charges (456) (374) (356)
Stock option expense(1) (65) (77) —
Pension and other postretirement benefits (expense)(1) (322) (459) (561)
Repositioning and other charges(1) (543) (483) (400)
Income from continuing operations before taxes $ 3,321 $ 2,798 $ 2,296
(1) Amounts included in cost of products and services sold and selling, general and administrative expenses.
Note 24—Geographic Areas—Financial Data
Net Sales(1) Long-lived Assets(2)
Years Ended December 31, Years Ended December 31,
2007 2006 2005 2007 2006 2005
United States $ 21,101 $ 19,821 $ 17,956 $ 11,916 $ 11,438 $ 10,842
Europe 9,104 7,781 6,552 2,706 2,161 1,958
Other International 4,384 3,765 3,144 1,036 848 691
$ 34,589 $ 31,367 $ 27,652 $ 15,658 $ 14,447 $ 13,491
(1) Sales between geographic areas approximate market and are not significant. Net sales are classified
according to their country of origin. Included in United States net sales are export sales of $3,427, $3,493 and
$2,780 million in 2007, 2006 and 2005, respectively.
(2)
Long-lived assets are comprised of property, plant and equipment, goodwill and other intangible assets.
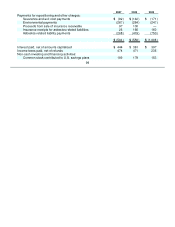
Note 25—Supplemental Cash Flow Information
Years Ended December 31,