Honeywell 2007 Annual Report Download - page 135
Download and view the complete annual report
Please find page 135 of the 2007 Honeywell annual report below. You can navigate through the pages in the report by either clicking on the pages listed below, or by using the keyword search tool below to find specific information within the annual report.-
 1
1 -
2
-
3
-
4
-
5
-
6
-
7
-
8
-
9
-
10
-
11
-
12
-
13
-
14
-
15
-
16
-
17
-
18
-
19
-
20
-
21
-
22
-
23
-
24
-
25
-
26
-
27
-
28
-
29
-
30
-
31
-
32
-
33
-
34
-
35
-
36
-
37
-
38
-
39
-
40
-
41
-
42
-
43
-
44
-
45
-
46
-
47
-
48
-
49
-
50
-
51
-
52
-
53
-
54
-
55
-
56
-
57
-
58
-
59
-
60
-
61
-
62
-
63
-
64
-
65
-
66
-
67
-
68
-
69
-
70
-
71
-
72
-
73
-
74
-
75
-
76
-
77
-
78
-
79
-
80
-
81
-
82
-
83
-
84
-
85
-
86
-
87
-
88
-
89
-
90
-
91
-
92
-
93
-
94
-
95
-
96
-
97
-
98
-
99
-
100
-
101
-
102
-
103
-
104
-
105
-
106
-
107
-
108
-
109
-
110
-
111
-
112
-
113
-
114
-
115
-
116
-
117
-
118
-
119
-
120
-
121
-
122
-
123
-
124
-
 125
125 -
 126
126 -
 127
127 -
 128
128 -
 129
129 -
 130
130 -
 131
131 -
 132
132 -
 133
133 -
 134
134 -
 135
135 -
 136
136 -
 137
137 -
 138
138 -
 139
139 -
 140
140 -
 141
141 -
 142
142 -
 143
143 -
 144
144 -
 145
145 -
146
-
147
-
148
-
149
-
150
-
151
-
152
-
153
-
154
-
155
-
156
-
157
-
158
-
159
-
160
-
161
-
162
-
163
-
164
-
165
-
166
-
167
-
168
-
169
-
170
-
171
-
172
-
173
-
174
-
175
-
176
-
177
-
178
-
179
-
180
-
181
 |
 |

HONEYWELL INTERNATIONAL INC.
NOTES TO FINANCIAL STATEMENTS—(Continued)
(Dollars in millions, except per share amounts)
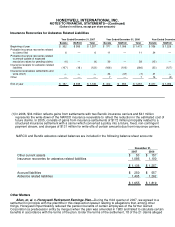
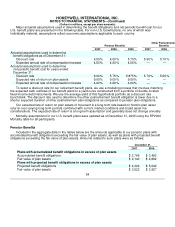
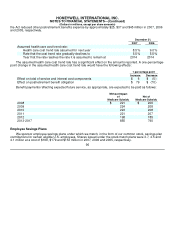
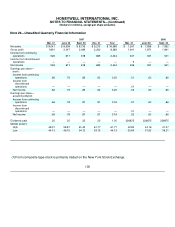
Our U.S. pension plans assets were $13.0 and $12.8 billion and our non-U.S. pension plans assets were
$4.2 and $3.8 billion at December 31, 2007 and 2006, respectively. Our asset allocation and target allocation for
our pension plans assets are as follows:
Asset Category
Percentage
of Plans
Assets at
December 31,
Long-term
Target
Allocation
2007 2006
Equity securities 63% 63% 45-70%
Debt securities, including cash 26 29 15-30
Real estate 6 5 5-10
Other 5 3 5-15
100% 100%
Our asset investment strategy focuses on maintaining a diversified portfolio using various asset classes in
order to achieve our long-term investment objectives on a risk adjusted basis. Our actual invested positions in
various securities change over time based on short and longer-term investment opportunities. To achieve our
objectives, our U.S. investment policy requires that our U.S. Master Retirement Trust be invested as follows: (a)
no less than 5 percent be invested in fixed income securities; (b) no more than 10 percent in private real estate
investments; and (c) no more than 18 percent in other investment alternatives involving limited partnerships of
various types. There is no stated limit on investments in publicly-held U.S. and international equity securities. Our
non-U.S. investment policies are different for each country, but the long-term investment objectives remain the
same.
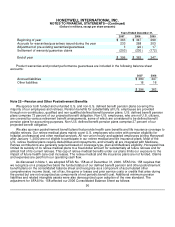
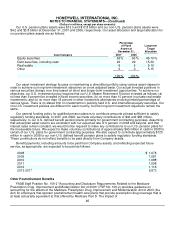
Our general funding policy for qualified pension plans is to contribute amounts at least sufficient to satisfy
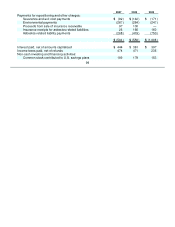
regulatory funding standards. In 2007 and 2006, we made voluntary contributions of $42 and $68 million,
respectively, to our U.S. defined benefit pension plans primarily for government contracting purposes. Assuming
that actual plan asset returns are consistent with our expected rate of 9 percent in 2008 and beyond, and that
interest rates remain constant, we would not be required to make any contributions to our U.S. pension plans for
the foreseeable future. We expect to make voluntary contributions of approximately $40 million in cash in 2008 to
certain of our U.S. plans for government contracting purposes. We also expect to contribute approximately $125
million in cash in 2008 to our non-U.S. defined benefit pension plans to satisfy regulatory funding standards.
These contributions do not reflect benefits to be paid directly from Company assets.
Benefit payments, including amounts to be paid from Company assets, and reflecting expected future
service, as appropriate, are expected to be paid as follows:
2008 $ 1,076
2009 1,081
2010 1,088
2011 1,098
2012 1,116
2013-2017 5,873
Other Postretirement Benefits
FASB Staff Position No. 106-2 "Accounting and Disclosure Requirements Related to the Medicare
Prescription Drug, Improvement and Modernization Act of 2003" (FSP No. 106-2) provides guidance on
accounting for the effects of the Medicare Prescription Drug, Improvement and Modernization Act of 2003 (the
Act) for employers that sponsor postretirement health care plans that provide prescription drug coverage that is
at least actuarially equivalent to that offered by Medicare Part D. The impact of
95